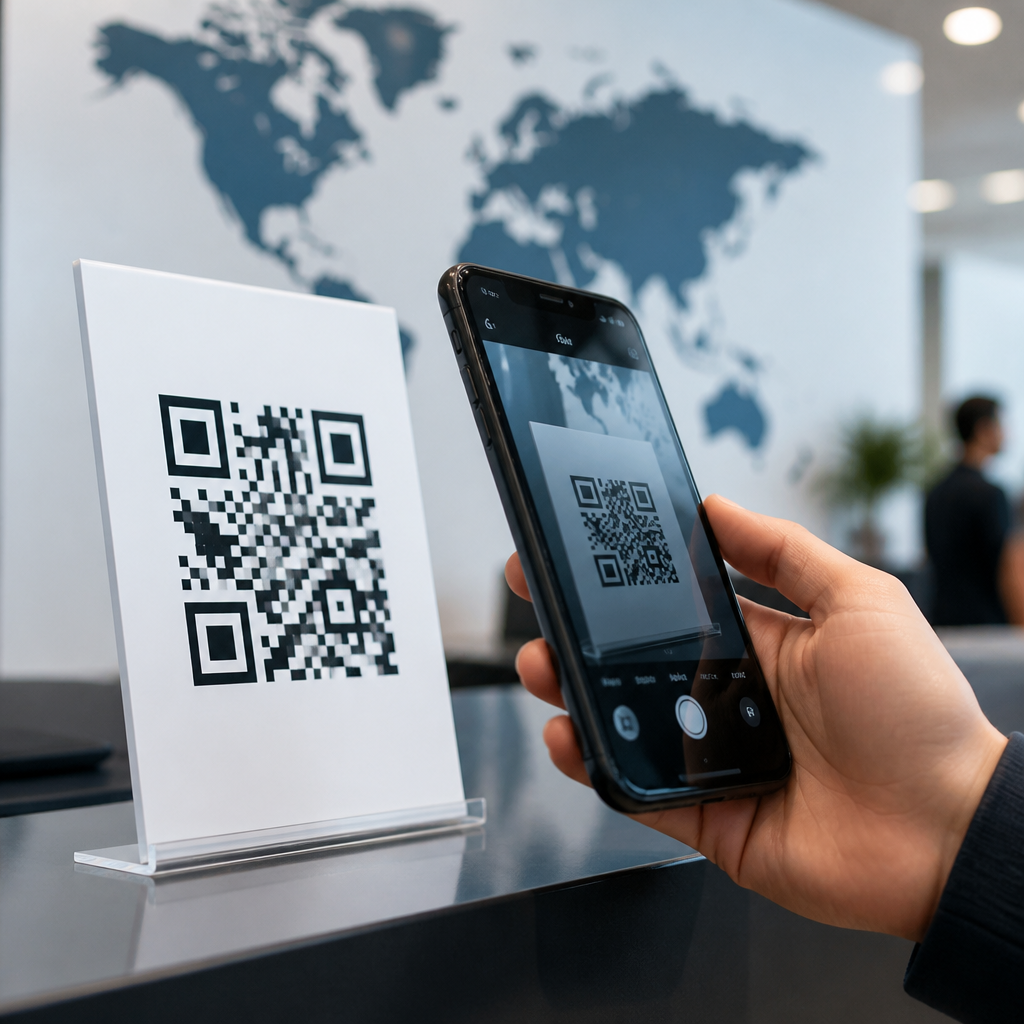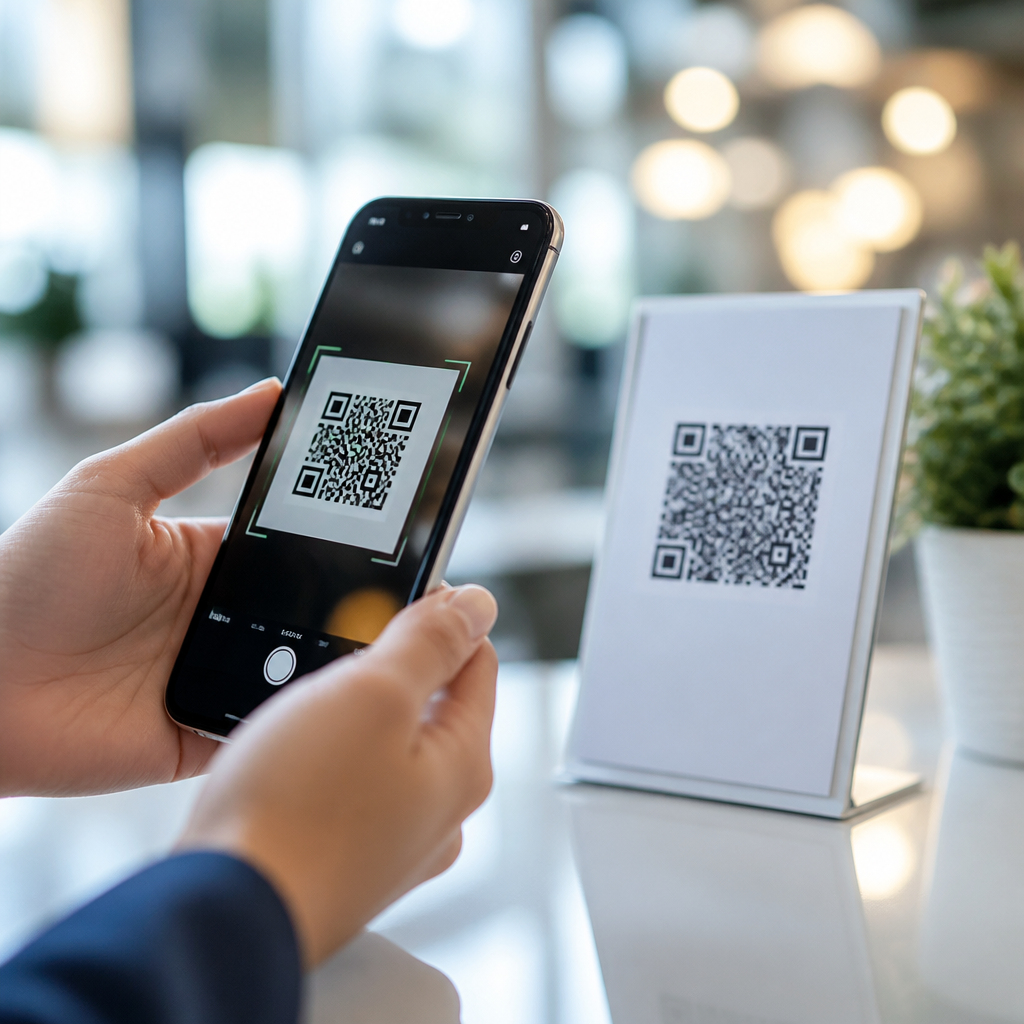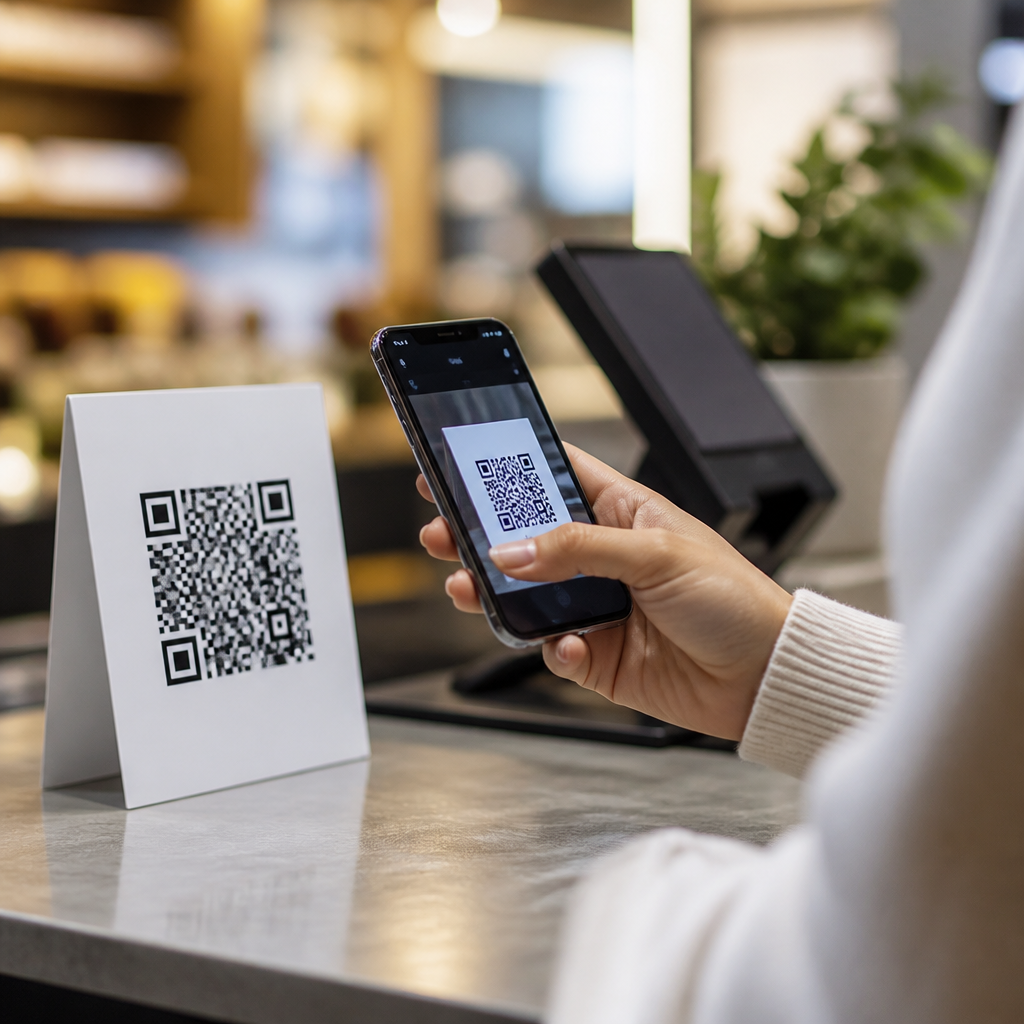

QR code usage statistics have moved from novelty metrics to core digital marketing indicators, because the small square code now connects physical attention to measurable online action at scale. A QR code, or quick response code, is a two-dimensional barcode that stores data such as a URL, payment link, app download, menu, coupon, form, or product identifier. For marketers, the value is simple: a scan turns offline media into trackable digital traffic without requiring a user to type a long address. I have used QR campaigns across retail packaging, event signage, direct mail, and out-of-home placements, and the pattern is consistent: when the code is relevant, visible, and paired with a clear call to action, scan rates become a reliable performance signal.
This matters because consumer behavior has changed permanently since smartphone cameras began recognizing QR codes natively on iPhone and Android devices. What once needed a separate app is now built into the default camera experience for most users. That shift removed friction and expanded use cases across payments, ticketing, product information, loyalty programs, restaurant ordering, and customer support. Marketers now need more than broad claims that QR codes are “growing.” They need QR code usage statistics that explain where adoption is happening, what drives scans, which channels perform best, and how to benchmark results realistically.
As a hub article, this guide covers the most important QR code statistics and the context behind them. It also answers practical questions searchers usually ask: how many people scan QR codes, who uses them most, what industries see the highest engagement, and what numbers actually matter when evaluating campaign success. The headline takeaway is clear: QR codes work best when they are treated as part of a full-funnel measurement system, not as a decorative add-on.
QR code adoption statistics show mainstream consumer behavior
The most important trend in QR code usage statistics is mainstream adoption. In the United States, surveys over the past several years have shown tens of millions of smartphone users scanning QR codes annually, with adoption strongest among younger adults but increasingly common across all age groups. Industry research from sources such as Statista, eMarketer, and mobile engagement platforms consistently points in the same direction: QR scanning became normalized during the pandemic and stayed normalized afterward. That persistence matters more than a single-year spike because it signals habit formation, not temporary necessity.
In practice, I have seen this normalization change stakeholder expectations. Five years ago, teams often asked whether customers understood how to scan a code. Today, the better question is whether the code gives them a reason to scan. Consumer familiarity is no longer the primary barrier. Relevance, placement, and destination quality are. Globally, adoption is even broader in markets where QR codes are embedded in payments and messaging ecosystems, particularly across parts of Asia. That international usage influences user expectations everywhere else, especially for travelers and digitally active consumers who already associate QR codes with convenience.
Another notable statistical pattern is frequency. Many users do not scan just once a year; they scan repeatedly in routine contexts such as menus, event check-in, transit, receipts, and packaging. Repeated exposure builds comfort, and comfort increases response rates in marketing environments. For digital marketers, that means QR codes should be evaluated as an established response mechanism alongside search, email, SMS, and social traffic sources.
Where QR code scans happen and what marketers can learn
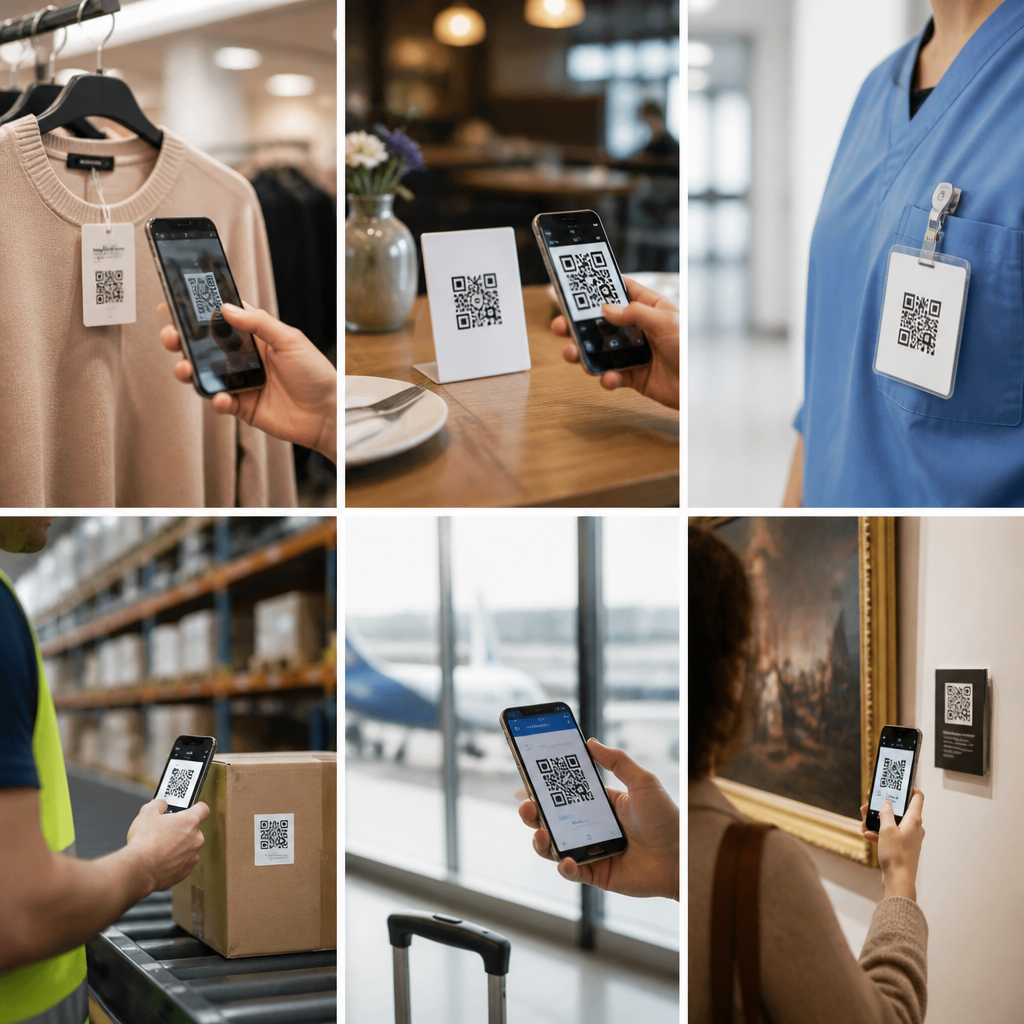
QR code usage statistics vary sharply by channel, and that variance is where strategy matters. Packaging performs well because the product is already in the customer’s hand, which lowers attention cost. In-store signage works when the code solves an immediate problem, such as finding inventory, accessing product specs, joining loyalty, or redeeming a time-sensitive offer. Direct mail often produces strong scan intent because recipients can act instantly from a physical piece without typing a URL. Events remain one of the highest-fit environments because registration, agenda access, lead capture, and session feedback all map naturally to a scan.
Out-of-home advertising is more mixed. Billboards, transit shelters, and street posters can generate meaningful scan volume, but only when audience dwell time is long enough and the landing experience is fast. A code on a moving bus with a tiny call to action is weak execution, not proof that the format fails. By contrast, a subway platform poster offering a local discount, directions, or ticket purchase can perform well because the user has time, context, and motivation.
| Channel | Typical user intent | Why scans succeed or fail |
|---|---|---|
| Packaging | Product details, warranty, how-to content | High relevance; strong because the product is physically present |
| Direct mail | Claim offer, book appointment, visit landing page | Works when the incentive is clear and friction is low |
| In-store signage | Compare products, join loyalty, get coupon | Depends on placement, visibility, and mobile page speed |
| Events | Check-in, agenda, lead capture, follow-up | Usually strong because scanning is expected behavior |
| Out-of-home | Learn more, navigate, buy tickets | Needs dwell time, concise CTA, and strong connectivity |
The lesson from these comparisons is direct: the best QR code usage statistics come from matching context to intent. A code should answer the user’s next question immediately. If it does not, scan rates drop regardless of creative quality.
Demographic and device trends behind QR code usage statistics
Age remains a major variable in QR code usage statistics, but the gap is narrowing. Younger consumers still scan more often, largely because they are more comfortable switching between physical and digital experiences in real time. However, older demographics adopted scanning rapidly during health, travel, and service interactions, and many retained the behavior. Income and urban density also matter. Higher-income consumers tend to encounter more QR-enabled retail and travel experiences, while dense urban areas expose people to more signage, payments, and transit-based scan opportunities.
Device behavior explains part of the story. Native camera recognition on iOS and Android reduced dependency on third-party scanner apps. Faster mobile networks and better landing page performance also increased completion rates after the scan. This is important because a scan is not the final metric. A marketer should measure the full path: scans, sessions, engaged sessions, form starts, purchases, app installs, or redemptions. In several campaigns I have audited, the QR code itself was blamed for weak results when the real problem was a slow mobile page, a nonresponsive form, or analytics that broke attribution.
Location data, when collected with consent and compliant analytics setup, adds another layer. Marketers can compare scans by store, city, event, or region, then optimize creative and offers locally. That makes QR code usage statistics operational, not just descriptive.
Industry-specific statistics and benchmark metrics that matter
Different sectors produce very different QR code usage statistics, so benchmarking must be industry specific. Restaurants and hospitality saw sharp adoption through digital menus, ordering, and guest services. Retail uses QR codes across shelf tags, packaging, loyalty enrollment, and post-purchase education. Healthcare applies them for patient forms, check-in, prescription information, and wayfinding. Real estate uses them on signs, brochures, and window displays to connect prospects to listings, virtual tours, and agent contact forms. B2B marketers increasingly use them at trade shows, sales collateral, and account-based direct mail because they simplify lead capture and content access.
The metrics that matter most are not limited to raw scans. Scan-through rate, unique versus total scans, time to first action, bounce rate, assisted conversion rate, and downstream revenue are more meaningful. Dynamic QR codes are especially valuable because they allow marketers to change the destination URL without replacing the printed asset, and they provide analytics on device type, location, and time of scan depending on the platform. Tools such as Bitly, QR Code Generator PRO, Beaconstac, Flowcode, and Uniqode are commonly used for campaign management and reporting.
A realistic benchmark starts with placement and intent. A product box linking to setup instructions may generate a high scan rate but low direct revenue, yet still reduce support costs and improve satisfaction. A direct mail code may drive fewer scans but more appointments because intent is stronger. The right interpretation depends on the job the code is meant to do.
Best practices for improving QR code performance in marketing campaigns
The strongest QR code usage statistics usually come from disciplined execution. Use dynamic codes, short mobile-first landing pages, and a visible call to action that states the benefit in plain language: “Scan to compare plans,” “Scan for 15% off,” or “Scan to watch setup.” Size matters; tiny codes underperform because users do not trust or notice them. Contrast matters too. Black on white is still the safest option, and heavy design customization can hurt readability if quiet zones are reduced or logos overpower the pattern. ISO and GS1 standards are relevant when codes support product identification, supply chain data, or retail interoperability.
Testing should cover distance, lighting, print material, camera types, and network conditions. Add UTM parameters so analytics platforms such as Google Analytics 4 can distinguish QR traffic by campaign, source, medium, placement, or store. For omnichannel programs, connect QR events to CRM records, coupon systems, point-of-sale data, or marketing automation platforms. That is how a simple scan becomes attributable business impact.
Privacy and trust also affect performance. Users are more likely to scan when branding is clear and the destination domain is recognizable. Avoid sending traffic to suspicious-looking URLs or cluttered pages. If a code initiates data collection, explain what the user will receive and how information will be used. Confidence drives action.
QR code usage statistics tell a clear story: scanning is now a normal consumer behavior, and for digital marketers it is one of the most efficient ways to connect offline touchpoints with measurable online outcomes. The most useful statistics are the ones tied to context, intent, and conversion quality, not vanity counts alone. Adoption is broad, repeat usage is common, and performance varies by channel, demographic mix, landing page quality, and offer strength.
For a sub-pillar hub on QR Code Usage Statistics, the practical takeaway is straightforward. Focus on channels where a scan solves an immediate need, measure beyond the scan itself, and benchmark results according to industry and campaign goal. When implemented well, QR codes reduce friction, improve attribution, and create a clearer path from attention to action.
Audit your current physical and offline media, identify one high-intent customer moment, and launch a tracked QR test with a specific mobile destination. The statistics will become more useful the moment they start reflecting your own audience.
Frequently Asked Questions
Why do QR code statistics matter so much to digital marketers today?
QR code statistics matter because they show how effectively marketers can convert offline attention into measurable online action. In the past, QR codes were often treated as a novelty, but today they function as a practical bridge between printed materials, physical locations, product packaging, out-of-home advertising, events, and digital destinations. When someone scans a code, that action can be tracked in ways similar to a click, which gives marketers visibility into engagement that traditional offline channels have historically lacked.
For digital marketers, this changes how campaign performance is evaluated. A flyer, poster, direct mail piece, store display, or product label is no longer just an awareness asset. With a QR code attached, it becomes a source of attributable traffic, lead generation, app downloads, coupon redemptions, registrations, and even purchases. The statistics around scan volume, unique users, time of day, location, device type, and conversion behavior help marketers understand whether their creative, offer, placement, and audience targeting are working. In other words, QR code metrics turn physical media into something much closer to a performance channel.
That is why QR code usage data has become a core marketing indicator rather than a side metric. It helps teams compare offline and online touchpoints with greater confidence, optimize campaigns in real time, and justify spend across channels that were once hard to measure precisely.
What are the most important QR code metrics marketers should track?
The most important QR code metrics go well beyond raw scan count. Total scans are useful because they indicate overall engagement volume, but on their own they can be misleading. Marketers should also pay close attention to unique scans, which help distinguish repeat interactions from first-time engagement. This gives a clearer picture of actual audience reach and helps identify whether a code is attracting broad interest or repeated use from a smaller segment of users.
Conversion-focused metrics are equally important. After the scan, marketers should measure what happens next: landing page visits, bounce rate, form completions, coupon redemptions, purchases, app installs, menu views, or any other intended action. A QR code that generates many scans but few downstream conversions may indicate friction on the landing page, weak offer alignment, slow load times, or poor message match between the physical asset and digital destination.
Contextual data also matters. Device type can reveal whether the mobile experience is truly optimized. Time-based trends can show when audiences are most likely to engage. Geographic or location-level reporting can highlight top-performing stores, event zones, packaging runs, or outdoor placements. Marketers should also track source-level performance by assigning different dynamic QR codes to different channels, creatives, or locations. This makes it possible to compare a direct mail version against an in-store display, or one poster headline against another.
Finally, scan-to-conversion rate is one of the most valuable summary metrics because it captures not just interest, but effectiveness. The best reporting framework treats QR codes like performance assets: impressions where available, scans, unique users, conversions, and revenue or lead value tied back to the original offline touchpoint.
How do QR codes improve attribution and campaign measurement?
QR codes improve attribution by creating a direct and trackable path from a physical interaction to a digital action. Traditionally, many offline marketing channels have been difficult to measure with precision. A customer may see a poster, receive a mailer, or notice packaging in a retail environment, but proving which exposure drove a website visit or sale has often relied on estimates, surveys, or broad correlation. QR codes reduce that uncertainty by giving audiences a specific action to take that can be logged immediately.
When marketers use dynamic QR codes, UTM parameters, campaign-specific landing pages, or integrated analytics platforms, they can identify exactly which asset generated traffic. For example, a brand can assign separate QR codes to individual store windows, product SKUs, event booths, print ads, or regional campaigns. That structure allows teams to compare performance with much more granularity than simply looking at total site traffic during a promotion. It also supports more accurate budget decisions because marketers can see which placements and messages lead to meaningful results.
QR codes also strengthen multi-touch measurement. A scan may not always produce an immediate sale, but it can bring users into remarketing funnels, email capture flows, app journeys, or product education sequences. That makes the initial offline interaction part of the broader customer journey rather than an unmeasured awareness step. In practical terms, attribution becomes more complete because marketers can connect physical media to sessions, leads, conversions, and downstream revenue.
While QR code data is not the only measurement input marketers should use, it significantly improves visibility. It provides concrete behavioral evidence that an offline asset generated digital engagement, which is why it has become so valuable in modern cross-channel reporting.
What makes a QR code campaign successful from a marketing perspective?
A successful QR code campaign combines strong intent, clear creative, and a frictionless mobile experience. The code itself is only the access point. What determines success is whether the user understands why they should scan, trusts the destination, and receives enough value to take the next step. That is why high-performing campaigns usually feature a clear call to action near the code, such as “Scan to claim 20% off,” “Scan to view the full product demo,” or “Scan to download the app.” Without context, even a visible QR code may not generate strong engagement.
Placement is another major success factor. Codes work best when they are easy to notice, large enough to scan quickly, and positioned in locations where people have time and incentive to act. A QR code on product packaging may support research at home, while a code in a transit station may need an especially simple offer because attention is limited. Campaign goals also matter. Some QR codes are designed for awareness and traffic, while others are built for lead capture, payments, loyalty enrollment, or coupon redemption. Success should always be judged against that intended outcome.
The landing experience is just as important as the physical presentation. The destination should load quickly, match the promise made near the code, and be optimized for mobile. Long forms, cluttered layouts, and generic homepage redirects often reduce conversion rates. Marketers who see strong results typically create purpose-built landing pages and test variants by offer, location, and audience segment.
From an analytics perspective, successful campaigns are structured for learning. Each code should be tied to a specific channel, asset, or audience so performance can be compared and improved. In that sense, the strongest QR code campaigns are not just scannable; they are strategically designed, easy to use, and fully measurable.
Are QR codes effective across industries, or only in a few specific use cases?
QR codes are effective across a wide range of industries because their core function is highly flexible: they reduce friction between a physical moment and a digital action. In retail, they can connect packaging, shelf displays, and signage to product details, reviews, promotions, loyalty programs, or checkout experiences. In restaurants and hospitality, they can support menus, ordering, reservations, guest information, and contactless service. In events and entertainment, they can power ticketing, schedules, lead capture, sponsorship activations, and audience engagement.
B2B marketers also benefit from QR codes in settings like trade shows, printed collateral, office signage, direct mail, and product documentation. A code can route prospects to a demo request page, case study, webinar registration, or sales contact form without requiring manual typing. In healthcare, education, real estate, financial services, consumer packaged goods, and nonprofit outreach, the same principle applies: QR codes create a low-friction path to information, forms, payments, donations, applications, or support content.
What changes by industry is not whether QR codes work, but how they should be implemented and measured. A retailer may focus on scan-to-purchase rate, while an event marketer may prioritize registrations or booth visits. A restaurant may track menu views and table turnover impacts, while a direct mail campaign may measure scan rate and cost per lead. The strongest results usually come when the code serves a clear user need in the moment rather than acting as a generic link.
So yes, QR codes are broadly effective, but their performance depends on context, audience intent, and execution quality. For digital marketers, that versatility is exactly why QR code statistics are so valuable: they reveal how one simple tool can support very different business goals across many channels and industries.