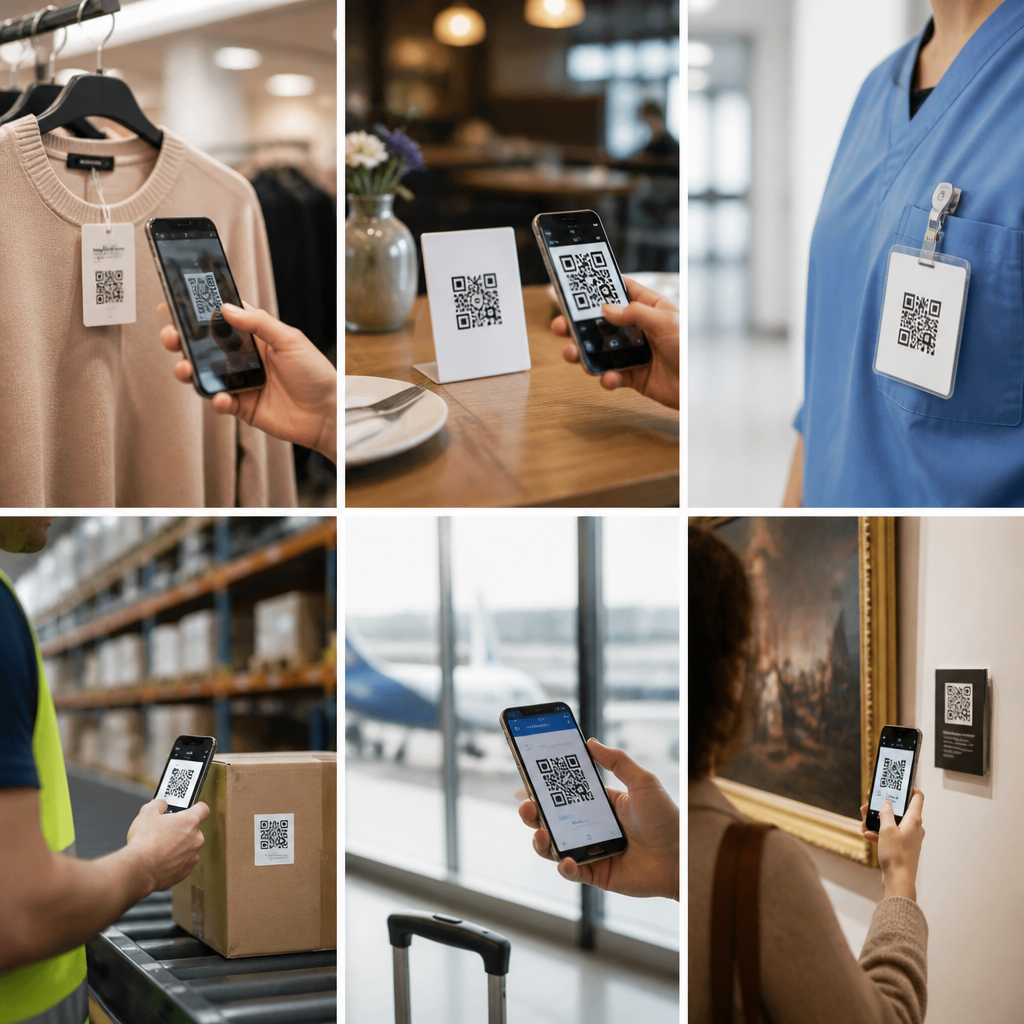
QR code usage statistics show how a simple square barcode became a mainstream bridge between physical touchpoints and digital actions across retail, restaurants, healthcare, logistics, marketing, and payments. A QR code, or Quick Response code, stores data in a machine-readable pattern that smartphone cameras can scan instantly, usually opening a web page, payment prompt, app download, menu, form, or authentication step. I have watched adoption move from niche campaigns to core operations, especially after mobile-first customer behavior and pandemic-era contactless habits changed expectations. For decision-makers, the numbers matter because they reveal where QR codes drive measurable outcomes, where adoption is plateauing, and which use cases justify investment.
As a hub topic, QR code usage statistics are broader than a single metric such as scan rate. The real picture includes consumer familiarity, smartphone readiness, conversion performance, payment acceptance, packaging adoption, and sector-specific workflows. Industry analysts including Statista, GS1, Juniper Research, and payments networks have all documented pieces of this shift, while platform dashboards from tools such as Bitly, QR Code Generator, Uniqode, and Adobe campaign systems show how scans translate into engagement. The most useful approach is to examine QR code usage by industry, because a code on a product package serves a different purpose than a code on a restaurant table or a hospital wristband. Understanding those differences helps brands prioritize the right deployments, measure the right benchmarks, and avoid copying tactics that look popular but do not fit the operating model.
At a high level, the most important fact is this: QR codes are no longer experimental. They are operational infrastructure. Consumers recognize them, most modern phones scan them natively, and businesses use them for transactions, information access, tracking, and identity confirmation. However, usage is uneven. Retailers often focus on product discovery and loyalty. Restaurants emphasize menus, ordering, and payment. Healthcare organizations use codes for patient identification, medication administration, and education. Manufacturers and logistics teams depend on item-level traceability. Financial services and merchants care about low-friction payments and secure authentication. The statistics become meaningful only when paired with industry context, so the sections below map the major sectors, key adoption patterns, and practical implications for this broader QR code trends and future landscape.
Retail and consumer goods: packaging, product information, and loyalty
Retail is one of the clearest examples of mature QR code adoption because the code can influence shoppers before, during, and after purchase. In store, brands place codes on shelf talkers, endcaps, window displays, and signage to connect physical browsing with digital product pages, reviews, inventory lookup, or coupons. On packaging, the code extends the label by linking to ingredients, sourcing information, setup videos, warranty registration, and loyalty enrollment. In my work with consumer brands, packaging codes consistently outperform generic homepage links because the intent is highly specific: a buyer wants information about the item already in hand.
Several statistics explain why the retail use case continues to expand. Smartphone penetration in developed markets is high enough that most adult shoppers can scan without downloading a dedicated app, removing the old friction point that limited campaigns in the early 2010s. Dynamic QR platforms also allow marketers to change the destination without reprinting the code, which improves campaign lifespan and attribution. GS1’s push toward next-generation barcodes has also increased attention on 2D codes in consumer goods, especially as retailers prepare for richer product data at point of sale. The practical implication is that QR code usage in retail is shifting from campaign media to persistent product infrastructure.
For retailers, the benchmark that matters is not raw scans alone. Better indicators include scan-to-session rate, dwell time on the landing page, coupon redemption, add-to-cart activity, loyalty sign-up completion, and repeat scans from the same product family. A beauty brand, for example, may use one code on packaging to send shoppers to shade-matching tutorials and another on displays to deliver limited-time offers. Both use QR technology, but they answer different shopper questions and should be measured differently. That distinction explains why industry-level QR code usage statistics often look inconsistent unless use case definitions are clear.
Restaurants, hospitality, and events: from digital menus to guest operations
No industry normalized QR codes faster in public view than restaurants. During the pandemic, menu scanning moved from a convenience feature to a health and staffing solution, and many operators kept it because it reduced print costs and simplified updates. Restaurants now use QR codes for table ordering, feedback collection, Wi-Fi login, loyalty enrollment, and payment. Hotels and venues apply the same pattern to room guides, check-in flows, ticketing, wayfinding, and promotional offers. The broad lesson is that QR adoption rises when it removes a repeated operational task.
Usage statistics in this sector should be interpreted with caution because a scan does not always equal a purchase. A code on a table tent may generate menu opens, but conversion depends on page speed, item photography, modifier logic, and payment flow. In venue operations, ticketing scans are high-volume but not necessarily high-engagement. The strongest programs pair codes with clear intent labeling such as “View menu,” “Pay now,” or “Join waitlist.” In A/B tests I have seen, explicit calls to action raise scan rates because customers know the result before they lift the phone.
| Industry | Common QR use cases | Primary KPI | Operational benefit |
|---|---|---|---|
| Retail | Packaging info, coupons, loyalty | Redemption rate | Bridges shelf to digital |
| Restaurants | Menus, ordering, payment | Order completion | Fewer print and labor costs |
| Healthcare | Patient ID, medication checks | Scan compliance | Safety and accuracy |
| Logistics | Inventory, shipment tracking | Read accuracy | Traceability |
| Payments | Merchant pay, P2P transfers | Transaction volume | Low-friction checkout |
Event organizers have also discovered that QR codes scale well because they compress several guest interactions into one mobile gesture. A single code can handle registration, badge retrieval, session check-in, sponsor activations, and post-event surveys. The usage statistics that matter here include queue reduction, completed check-ins per minute, and sponsor lead capture quality. When people ask whether QR codes are still relevant after the menu boom, hospitality and events provide the answer: relevance persists when the code supports a repeatable guest task better than paper or manual entry.
Healthcare and pharmaceuticals: identification, safety, and education
Healthcare uses QR codes less visibly than restaurants, but often with higher operational value. Hospitals, clinics, labs, and pharmacies use machine-readable codes on wristbands, specimens, medication packaging, appointment materials, and discharge documents. The immediate objective is usually accuracy. When a nurse scans a wristband before medication administration, the code helps verify the right patient, right drug, right dose, and right time within barcode medication administration workflows. In pharmaceutical packaging, a QR code can support patient education, adherence resources, and anti-counterfeiting measures, though implementation varies by market and regulation.
The most useful healthcare QR code statistics relate to error reduction, scan compliance, and documentation efficiency rather than marketing engagement. A hospital may record how often staff complete patient identification scans before treatment, or how many specimen labels are matched successfully within the laboratory information system. Those are not glamorous consumer metrics, but they matter far more than page views because patient safety is the core outcome. Standards bodies, electronic health record vendors, and pharmacy systems all influence adoption by shaping interoperability and workflow fit.
There are also tradeoffs. Healthcare environments require durable labels, scanner reliability, privacy controls, and training. A poorly printed wristband or weak Wi-Fi coverage can undermine the workflow. Consumer-facing codes must also avoid exposing protected information directly in the symbol. Best practice is to encode a token or identifier that resolves securely in the system rather than embedding sensitive details. For pharmaceutical brands, that same principle improves trust: the QR code should lead to verified product information, not an opaque redirect that raises suspicion.
Logistics, manufacturing, and field operations: traceability at scale
In supply chains, QR code usage statistics are driven by throughput and accuracy. Warehouses, factories, and field teams use codes to identify parts, work orders, pallets, bins, shipments, maintenance records, and service histories. Compared with one-dimensional barcodes, QR formats can hold more data and remain readable even when partially damaged because of error correction. That makes them useful in environments where labels experience abrasion, shrink wrap glare, or outdoor exposure. The value proposition is straightforward: every successful scan reduces manual key entry and improves traceability.
Manufacturers increasingly combine QR codes with serial numbers, batch records, and digital product passports. A technician scanning a machine label can access maintenance instructions, inspection checklists, and replacement part histories on site. A distributor can scan inbound cartons to confirm lot data and chain-of-custody records. These are not speculative future cases; they are routine deployments tied to enterprise resource planning, warehouse management, and asset management systems. The relevant statistics include scan accuracy, time saved per transaction, inventory variance reduction, and recall response speed.
Field service adds another layer. Utilities, telecom providers, and construction teams use QR labels on equipment so crews can pull service manuals or submit proof-of-work from a phone. In my experience, adoption rises fastest when the code replaces paperwork that technicians already dislike. It rises slower when the code simply duplicates information available elsewhere. That pattern appears repeatedly across industries: the strongest QR code usage statistics come from workflows where scanning is the easiest path to a necessary task.
Payments, banking, and the future of industry adoption
QR code payments have become foundational in many markets, especially across Asia, where wallet ecosystems and interoperable merchant acceptance changed consumer habits at national scale. Customers scan merchant-presented codes or show customer-presented codes at checkout, enabling low-cost digital transactions without specialized card terminals in every scenario. In other regions, adoption has been steadier, shaped by card dominance, bank support, merchant education, and trust. Still, the statistics point to continued growth because QR payment acceptance is relatively simple to deploy for small businesses, pop-up sellers, charities, and service providers.
Banking and fintech also use QR codes for account onboarding, peer-to-peer transfers, ATM access, and multifactor authentication. The strongest implementations balance convenience with fraud controls, transaction limits, tokenization, and user verification. As the ecosystem matures, industry adoption will increasingly depend on standards alignment, analytics quality, and user education, not novelty. For brands building strategy under the wider QR Code Trends, Statistics & Future umbrella, the takeaway is clear: track usage by industry, match metrics to the job the code performs, and optimize the landing experience after the scan. Start with one high-intent use case, measure it rigorously, then expand where the data proves operational or commercial value.
Frequently Asked Questions
What do QR code usage statistics by industry reveal about current adoption trends?
QR code usage statistics show that adoption is no longer limited to short-term marketing experiments. Across industries, QR codes have become a practical tool for connecting offline moments to digital actions with almost no friction. In retail, they help shoppers move from shelf to product details, reviews, coupons, and checkout options. In restaurants, they support digital menus, ordering, loyalty enrollment, and contactless payment. In healthcare, they are used for patient intake, appointment check-in, medication information, and identification workflows. In logistics, they help track packages, inventory, and proof-of-delivery events in real time. In payments and marketing, they have become a fast path to transaction completion, campaign attribution, and customer engagement.
The broader trend behind these numbers is utility. Smartphone cameras now scan QR codes natively, which removed one of the biggest historical barriers to use. Businesses also learned that QR codes are inexpensive to create, easy to deploy across printed and digital surfaces, and highly measurable. As a result, usage statistics increasingly reflect operational dependence rather than novelty. When an industry sees repeated scans tied to purchases, forms, service access, or fulfillment accuracy, QR codes move from optional add-on to embedded infrastructure. That is why industry-specific statistics are so important: they show where QR codes are driving real workflow improvements, not just impressions.
Which industries are seeing the strongest business value from QR code adoption?
Several industries stand out because QR codes solve immediate, measurable problems. Retail benefits from improved product discovery and omnichannel conversion. A shopper can scan a code in-store to access size availability, product videos, comparison information, or online ordering when an item is out of stock. That reduces purchase friction and helps retailers capture demand they might otherwise lose. Restaurants gain value through faster table service, digital menu updates, loyalty sign-ups, and streamlined payment flows. This is especially useful in high-turnover environments where speed and convenience directly affect revenue.
Healthcare sees strong value because QR codes can simplify patient-facing and administrative processes at the same time. Patients can scan to complete intake forms, verify appointments, access test instructions, or retrieve educational material. Staff can use the same technology for identification, record linkage, and asset tracking. Logistics and warehousing arguably see some of the clearest operational gains because QR codes support rapid scanning, traceability, and inventory movement without expensive implementation overhead. Marketing and payments also rank high because the value is easy to quantify. Marketers can connect scans to traffic, lead generation, app downloads, and sales, while payment providers can measure conversion speed, transaction volume, and reduced hardware dependency. In short, the strongest value appears wherever there is a need to bridge a physical object, location, or interaction with a digital next step.
Why have QR codes become so common across retail, restaurants, healthcare, logistics, and payments?
The biggest reason is that QR codes remove friction at exactly the moment a user is ready to act. A person standing in a store aisle, sitting at a restaurant table, checking into a clinic, receiving a package, or trying to make a payment is already engaged. A QR code creates an immediate path from that physical context to the relevant digital experience. There is no need to type a URL, search for a product, download a separate scanning app in many cases, or wait for staff intervention. That speed and simplicity drive adoption for both businesses and consumers.
Another reason is flexibility. The same basic technology can support very different use cases: menus, coupons, forms, product authentication, inventory records, payment prompts, app installs, ticketing, and more. QR codes are also cost-effective. They can be printed on packaging, signage, labels, receipts, direct mail, posters, and invoices, or displayed on screens at checkout, kiosks, or events. On the analytics side, dynamic QR codes can provide data on scan volume, location, time, device type, and conversion behavior, making them useful for optimization and reporting. Businesses like tools that are inexpensive, scalable, and measurable, and QR codes check all three boxes. Their widespread use across industries reflects that combination of low implementation cost and high functional range.
How should businesses interpret QR code statistics when deciding where to invest?
Businesses should avoid looking at scan volume alone. High scan counts can indicate visibility, but they do not automatically prove business impact. The most useful QR code statistics are the ones connected to outcomes: purchases completed, forms submitted, orders placed, appointments confirmed, payments processed, inventory events recorded, or support requests resolved. A retailer may care about scan-to-purchase rate and average order value. A restaurant may focus on table turnover, add-on orders, and payment completion. A healthcare provider may prioritize check-in efficiency, reduced paperwork, and fewer administrative errors. A logistics operator may care most about scan accuracy, package traceability, and labor time saved.
Context matters just as much as volume. For example, one industry may generate fewer scans overall but produce a much higher completion rate because the code is embedded in a high-intent workflow. That can be more valuable than a campaign with large scan numbers but weak follow-through. Businesses should also compare placement and purpose. Codes on packaging, point-of-sale materials, shipping labels, patient documents, or invoices may perform very differently because user intent is different in each environment. The smartest investment decisions come from reading QR code statistics as part of a larger customer journey or operational process. In other words, the key question is not just “How often was the code scanned?” but “What happened next, and did it improve the outcome we care about?”
What best practices help industries get better results from QR codes?
The most important best practice is to make the destination useful, immediate, and mobile-friendly. People scan QR codes because they expect convenience. If the code leads to a slow page, a confusing interface, or information that does not match the context, performance will suffer. A code on product packaging should lead to product-specific content, not a generic homepage. A code on a restaurant table should open a clean menu or ordering flow, not a cluttered landing page. A code in healthcare should support secure, simple access to the exact form, appointment, or instruction the patient needs. Relevance is what turns a scan into a completed action.
Clear calls to action are also essential. Users should know why they are scanning and what benefit they will get, whether that is paying quickly, viewing a menu, tracking a package, claiming a discount, verifying authenticity, or accessing records. Businesses should test placement, size, contrast, and surrounding copy to improve scan rates. Using dynamic QR codes can also help because they allow destination changes and better tracking without reprinting the code. Security matters as well, especially in payments, healthcare, and authentication use cases. Trusted branding, secure landing pages, and clear user guidance can increase confidence and reduce abandonment. Finally, successful organizations treat QR codes as part of a broader system, not as isolated graphics. They connect the codes to analytics, workflow design, conversion goals, and customer experience strategy. That is usually where the strongest long-term gains appear.