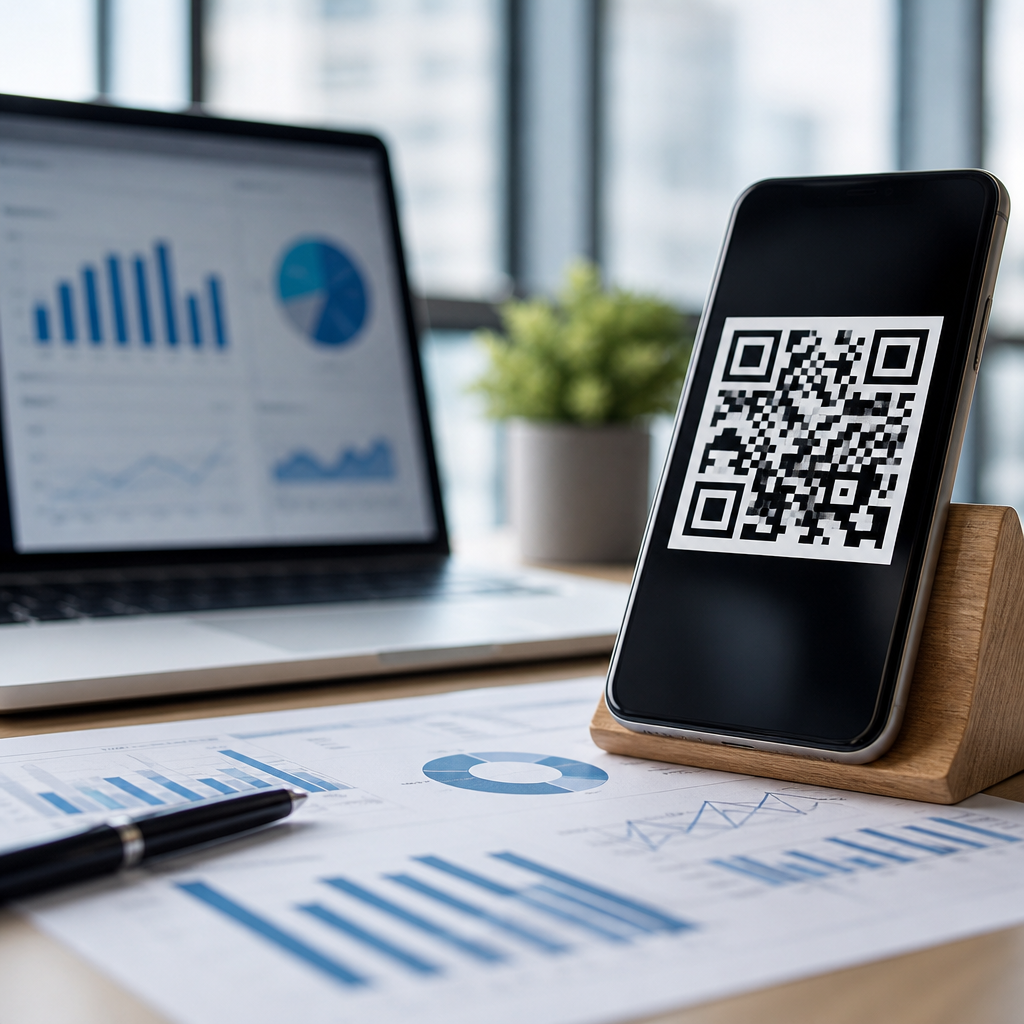
QR code usage statistics reveal how a once-niche barcode became a mainstream bridge between physical and digital experiences. A QR code, short for Quick Response code, is a two-dimensional matrix barcode that stores information such as URLs, payment credentials, product data, ticket details, or authentication tokens. Unlike traditional one-dimensional barcodes, QR codes can be scanned from any angle and can hold far more data in a compact square pattern. That technical advantage matters because businesses now need low-friction ways to connect packaging, posters, receipts, menus, and ads to mobile actions.
In my work with retail, restaurant, and event clients, I have seen adoption move from experimental campaigns to permanent operational infrastructure. The strongest driver was not novelty but convenience. Smartphone camera apps now recognize QR codes natively on iPhone and Android devices, removing the need for separate scanner apps that once slowed adoption. During the pandemic, touchless menus, check-ins, and payments accelerated public familiarity, but the habit persisted because scanning is simply faster than typing a web address or downloading a file from a kiosk.
Understanding QR code usage statistics matters for marketers, product teams, operations leaders, and publishers because these codes now influence traffic acquisition, conversion measurement, customer support, and in-store behavior. A scan can initiate payment, open an app deep link, verify a login, register a warranty, or attribute an offline campaign to online sales. As a result, usage data is no longer just a curiosity. It informs channel strategy, packaging design, media buying, and customer journey mapping. The most useful statistics are not isolated totals; they show where scans happen, why people scan, which industries benefit, and what trends signal future growth.
Current QR code adoption and scan growth
Recent QR code usage statistics show broad, durable adoption across consumer and business contexts. Industry reporting from QR TIGER, Statista summaries, and mobile commerce analyses consistently points to rising scan volume, rising consumer familiarity, and expanding business deployment. In the United States, millions of smartphone users scan QR codes annually, and global usage is materially higher because mobile payments and super-app ecosystems in Asia normalized scanning years earlier. The key takeaway is straightforward: QR code behavior is now habitual, not exceptional.
From campaign audits I have run, scan rates increase sharply when the code is tied to immediate value. A table tent linking to payment options performs better than a code leading to a generic homepage. The same pattern appears in published data. Consumers scan most often for actions with clear intent: viewing menus, redeeming offers, making payments, downloading apps, accessing event tickets, and getting product information. Frictionless intent explains why dynamic QR codes usually outperform static ones in commercial settings. Dynamic codes allow destination changes, UTM tracking, device-based routing, and scan analytics without reprinting the code itself.
Geography also shapes adoption. China and India established large-scale QR payment behavior through platforms such as Alipay, WeChat Pay, and Paytm. In North America and Europe, adoption accelerated later, driven by restaurant menus, omnichannel retail, ticketing, and packaging. The result is a more diversified use profile. In one client rollout across 300 retail locations, packaging QR codes generated fewer total scans than in-store signage, but packaging scans produced higher post-scan dwell time because shoppers were seeking product instructions and compatibility details. Volume alone never tells the full story; intent quality matters.
Where QR codes are used most
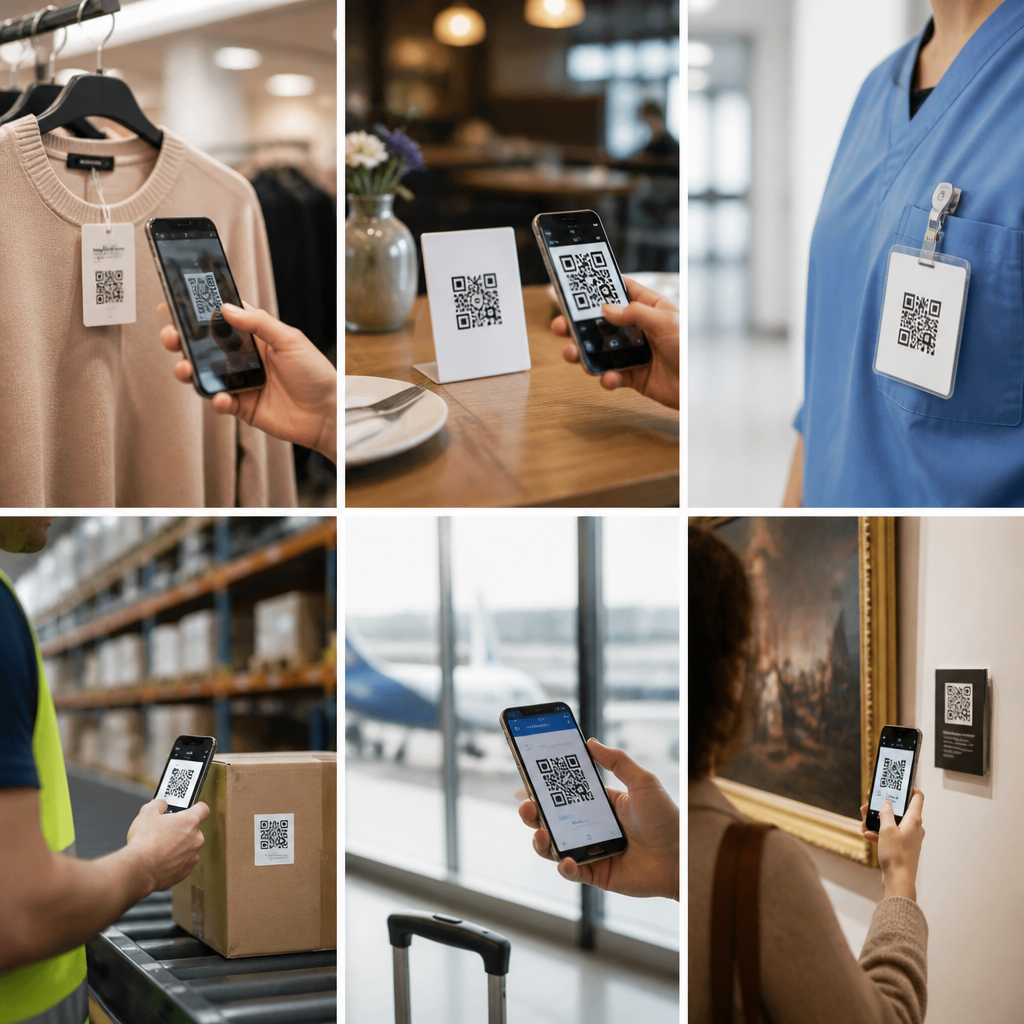
QR code usage statistics by industry show that hospitality, retail, payments, logistics, healthcare, and events are the leading sectors. Restaurants use codes for menus, ordering, reviews, loyalty enrollment, and bill payment. Retailers place codes on shelves, tags, product packaging, and window displays to connect shoppers with reviews, inventory, tutorials, and promotions. Logistics teams use them for package tracking, chain-of-custody records, and warehouse routing. Healthcare providers use them for patient forms, appointment check-ins, medication information, and device traceability under standards tied to unique device identification.
Events and travel provide some of the clearest examples of QR code utility. Digital boarding passes and ticketing codes reduce print costs, speed up entry, and improve fraud control. Museums use codes to deliver multilingual exhibit content without installing expensive hardware. Real estate agents place them on signs to open property pages, virtual tours, or lead forms. Manufacturers increasingly use product digital identity programs to support setup guides, spare parts ordering, and anti-counterfeit verification. In every case, the code works because it compresses a complex action into a scan.
| Industry | Common QR code use | Main performance goal |
|---|---|---|
| Restaurants | Menus, ordering, payment | Faster service and higher table turnover |
| Retail | Packaging, shelf tags, offers | Product education and conversion |
| Events | Tickets, schedules, access control | Entry speed and fraud reduction |
| Healthcare | Check-in, forms, medication info | Accuracy and lower administrative load |
| Logistics | Tracking, inventory movement | Visibility and operational efficiency |
| Payments | Peer-to-peer and merchant checkout | Low-cost digital transactions |
These industry patterns explain why QR code usage statistics keep climbing. The technology solves a real interface problem: how to connect physical surfaces to mobile actions instantly. Near-field communication can also do that, but QR codes are cheaper to deploy because they require no embedded chip, no power, and no specialized reader beyond a phone camera. That cost profile makes them especially attractive for small businesses and high-volume packaging runs.
Consumer behavior, demographics, and scan intent
Consumer QR code behavior is best understood through context rather than age alone. Younger users generally scan more often, but the biggest predictor is mobile confidence combined with a clear payoff. When a code promises ordering, discounts, authentication, or useful product information, older demographics scan too. In hospitality projects I have overseen, scan completion rates among guests over 55 improved noticeably after adding plain-language prompts such as “Scan to see menu and pay at table.” Instructional framing matters because many people still need confirmation that scanning is safe and worthwhile.
Intent categories are consistent across markets. Users scan to save time, avoid manual typing, complete payments, claim offers, or access trusted information at the point of need. Product packaging scans often happen post-purchase and support onboarding, care instructions, or reordering. In-store signage scans are more likely to be comparison-oriented, especially for electronics, cosmetics, and specialty food. A customer standing in an aisle may use a code to verify ingredients, watch a demo, or check whether another size is available online. That blend of physical shopping and digital research is now standard behavior.
Trust and design strongly affect results. Codes placed near branding, concise instructions, and a visible destination cue outperform isolated codes with no context. Error correction level, print contrast, quiet zone spacing, and size relative to scanning distance also influence usability. A technically valid code can still underperform if it is glossy, distorted, too small, or placed where cellular reception is weak. The practical lesson from QR code usage statistics is that growth depends as much on implementation quality as on consumer demand.
Measurement, benchmarks, and what the data really means
Businesses often ask what a good QR scan rate looks like, but there is no universal benchmark. Performance depends on placement, audience intent, incentive strength, and landing-page relevance. A code on direct mail may earn a modest scan rate yet deliver excellent revenue per scan. A code on packaging may generate lower immediate conversion but strong long-term retention because it reduces support friction. The right measurement stack includes total scans, unique scans, repeat scans, device type, time of day, location, bounce rate, conversion rate, and assisted revenue.
Tools such as Bitly, QR Code Generator, Beaconstac, Scanova, and first-party analytics platforms make this tracking practical. I recommend dynamic URLs with campaign parameters, server-side redirects, and dashboard segmentation by asset type. That setup distinguishes a window poster from a receipt, even if both lead to the same destination. It also supports A/B testing of call-to-action wording, destination pages, and code placement. In one campaign, changing the prompt from “Learn more” to “Scan for installation guide” nearly doubled qualified scans because the benefit became explicit.
Data interpretation requires caution. Total scans can be inflated by internal testing, repeated scans from the same user, or scans triggered by curiosity rather than purchase intent. Conversely, undercounting happens when the landing page loads poorly or when app handoffs break attribution. Good analysis looks beyond volume to business outcomes: completed payments, redeemed offers, registrations, support deflection, or reduced queue times. The most valuable QR code usage statistics are tied to a measurable operational or commercial result.
Emerging trends shaping the next phase of QR code growth
Several trends are expanding QR code relevance. First, connected packaging is moving from marketing experiment to product infrastructure. Brands increasingly use codes to host ingredient sourcing, recycling instructions, authentication records, and post-purchase service. Second, digital payments continue to normalize scan-to-pay behavior, especially in markets where card acceptance costs are high. Third, secure authentication use cases are growing, including passwordless login flows, device pairing, and account verification. Major platforms now train users to scan codes as part of everyday security tasks.
Another important development is the rise of standardized product identification. GS1 has advanced two-dimensional codes for retail environments so brands can encode richer data than a traditional UPC allows, including batch numbers and expiration dates. That shift matters for food traceability, recalls, and inventory accuracy. It also turns the same printed symbol into a tool for both checkout systems and consumer engagement. As scanners, point-of-sale software, and retailer workflows modernize, QR code usage statistics will increasingly reflect this dual operational and customer-facing role.
Looking ahead, the winning strategy is disciplined deployment. Use clear calls to action, mobile-optimized destinations, dynamic tracking, and placements tied to genuine user intent. Monitor scan quality, not just scan quantity. Treat each code as part of a journey, not a decoration. For brands building a QR code trends and statistics strategy, the evidence is already decisive: QR codes are a mature, low-cost interface that improves access, attribution, and convenience across industries. Review your physical touchpoints, identify one high-intent scan opportunity, and test it with measurable goals this quarter.
Frequently Asked Questions
What do the latest QR code usage statistics show about adoption and growth?
Recent QR code usage statistics consistently show that QR codes have moved far beyond their early use in manufacturing and inventory tracking. They are now a mainstream tool across retail, restaurants, payments, packaging, healthcare, logistics, events, and advertising. Growth accelerated sharply when businesses needed low-contact ways to connect offline customers with digital experiences, but adoption has remained strong because QR codes solve a practical problem: they reduce friction. A user can scan and instantly open a menu, complete a payment, download an app, verify a ticket, join a Wi-Fi network, or access product information without typing a long URL or searching manually.
The broader trend in the data is clear: QR code creation, scans, and campaign deployments have all increased as smartphone camera technology improved and consumer behavior became more mobile-first. Statistics often show strong year-over-year gains in scan volume, especially in industries where speed and convenience matter most. Another important takeaway is that QR code usage is no longer limited to a single region or demographic. While some markets have led adoption, especially in mobile payments, QR code usage has become globally familiar. For marketers and businesses, the numbers point to a durable shift rather than a temporary spike. QR codes are now part of standard customer journeys, not a novelty feature.
Why have QR codes become so popular with businesses and consumers?
QR codes became popular because they offer a simple, low-cost link between physical spaces and digital actions. For businesses, they are easy to generate, inexpensive to print, and flexible enough to support many use cases. A single code can send users to a website, payment page, product guide, sign-up form, support portal, or promotional offer. That makes them useful in everything from product packaging and point-of-sale displays to billboards and event badges. Businesses also value the ability to update destinations with dynamic QR codes and measure engagement through scan data, which turns a printed asset into a trackable digital touchpoint.
For consumers, the appeal is convenience. Modern smartphones can scan QR codes directly from the native camera app, removing the need for a separate scanner. That ease of use matters because it eliminates extra steps. Instead of typing a web address, downloading a PDF manually, or waiting for a cashier to process information, users get immediate access with one scan. QR codes also support behavior that aligns with current expectations: faster checkout, contactless interaction, instant information, and mobile self-service. In short, popularity comes from utility. QR codes save time, reduce friction, and work well in environments where speed, accuracy, and convenience are priorities.
Which industries are seeing the highest QR code usage today?
Several industries stand out in QR code usage statistics, with retail, food service, payments, and marketing leading the way. In retail, QR codes are widely used for product details, loyalty programs, customer reviews, app downloads, and in-store promotions. On packaging, they can connect shoppers to ingredient lists, sustainability information, authenticity verification, care instructions, or reorder pages. In restaurants and hospitality, QR codes became especially common for digital menus, ordering systems, reservations, guest feedback, and contactless service interactions.
Payments are another major category. In many markets, QR-based payment systems are deeply integrated into everyday transactions, from street vendors and taxis to major retailers and e-commerce platforms. Healthcare has also expanded QR code use for patient check-in, medication tracking, appointment management, and secure access to records or test results. In logistics and manufacturing, QR codes support asset tracking, inventory visibility, maintenance workflows, and documentation access. Meanwhile, advertisers and event organizers use them to bridge offline impressions with measurable digital engagement, such as landing pages, registrations, ticket verification, and real-time campaign experiences. The strongest usage appears in industries where physical-to-digital transitions happen frequently and where reducing user effort creates immediate value.
How do businesses use QR code statistics to measure performance and improve campaigns?
Businesses use QR code statistics to understand how effectively their physical materials drive digital engagement. At the most basic level, they track scan volume, unique scans, time of day, device type, and geographic location. Those metrics help answer practical questions: Which poster, package, store display, or mailer generated the most interest? Which region responded best? Did a campaign perform better on weekends or during certain hours? If a QR code leads to a landing page, businesses can also measure downstream actions such as purchases, sign-ups, downloads, bookings, or form completions. This turns QR codes into more than access tools; they become measurable marketing and operational assets.
Performance data is particularly useful when paired with testing. Businesses can compare different calls to action, placements, designs, incentives, and destination pages to see what drives higher scan and conversion rates. For example, a QR code labeled “Scan for 20% off” may outperform one with no explanation, and a code placed at checkout may perform differently from one placed on product shelves or packaging. Dynamic QR codes make optimization easier because businesses can update destinations without reprinting materials. Over time, usage statistics help organizations refine user journeys, allocate budgets more effectively, and identify where QR codes produce the strongest return. The most successful strategies rely on both scan data and post-scan outcomes, not just raw scan counts.
What trends are shaping the future of QR code usage?
Several trends are shaping the next phase of QR code adoption. One of the biggest is deeper integration with mobile payments, digital identity, and authentication. QR codes are increasingly used not just to open webpages, but to facilitate secure transactions, ticket validation, account login, device pairing, and access control. Another key trend is smarter packaging. Brands are using QR codes to create richer post-purchase experiences, including how-to content, traceability data, warranty registration, recycling guidance, and personalized offers. As consumers expect more transparency and interactivity, QR-enabled packaging is becoming more strategically important.
Personalization and analytics are also advancing. Businesses are using dynamic QR codes to segment audiences, localize destination content, and adapt experiences based on campaign source or user context. In parallel, design improvements are making codes more visually aligned with brand identity while still remaining scannable. There is also a growing emphasis on security and trust, since consumers are more aware of phishing risks and businesses need to make destinations feel credible and safe. Looking ahead, QR code usage statistics will likely continue to reflect expansion wherever there is a need to connect physical touchpoints with measurable digital actions. The underlying trend is not just more scans, but more strategic use cases, better user experiences, and tighter integration into everyday digital ecosystems.