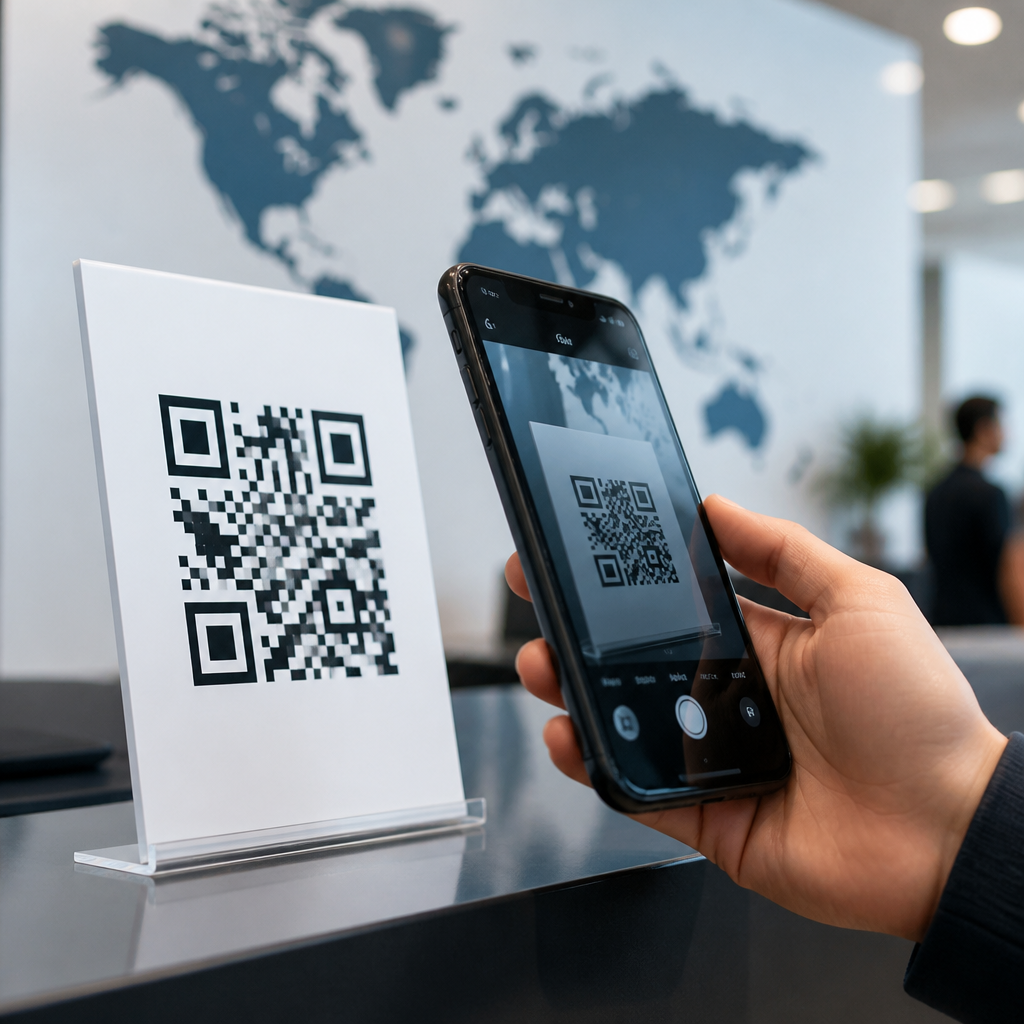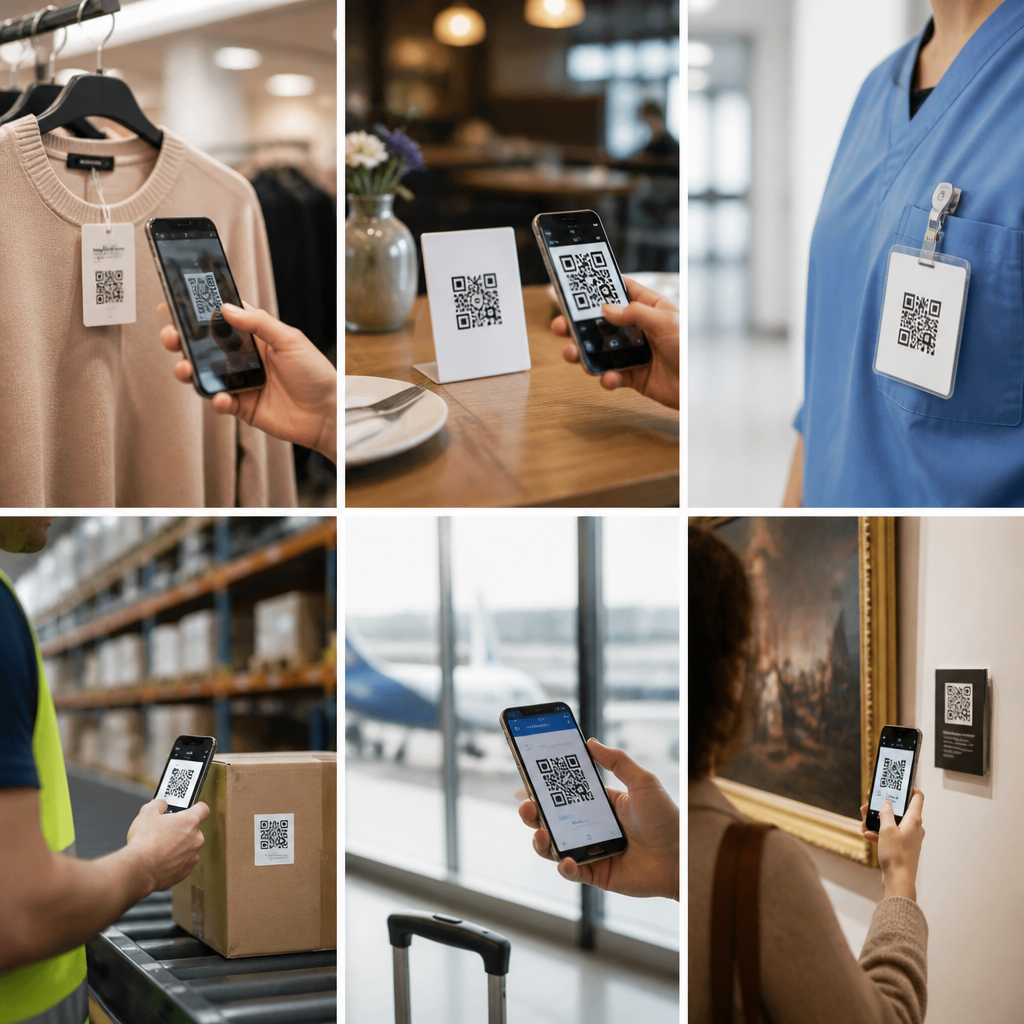
Mobile QR code scanning has moved from a niche behavior to a mainstream habit, and the latest mobile QR code scanning growth statistics show why brands, retailers, publishers, and public institutions now treat QR codes as core digital infrastructure. A QR code, or Quick Response code, is a two-dimensional barcode that stores data such as a URL, payment token, menu, app download, ticket, or contact record. When a smartphone camera or wallet app reads that pattern, it turns a printed surface, product package, sign, or screen into an instant digital touchpoint. That simple bridge between offline attention and online action is why QR code usage statistics matter.
In practice, I have seen adoption accelerate fastest when scanning requires no extra app. Native camera support on iPhone and Android removed the biggest friction point. During the pandemic, restaurants replaced paper menus, retailers expanded touchless payments, and event operators shifted to mobile tickets. Those use cases trained consumers to scan without hesitation. Since then, the behavior has spread into packaging, connected TV ads, out-of-home media, logistics, and authentication.
For marketers and operators, mobile QR code scanning growth statistics answer three essential questions. First, how large is the addressable audience? Second, which industries and regions are driving usage? Third, what conditions increase scan rates and post-scan conversions? This hub article covers all three, while also explaining how to interpret QR code usage statistics responsibly. Raw scan volume alone can mislead. The strongest analysis separates unique scanners from repeat scans, tracks device type and location, and measures what happens after the scan, including bounce rate, form completion, purchase, wallet save, or app install.
Several market signals point in the same direction. Smartphone penetration continues to rise globally, mobile internet access is now the default for most consumers, and operating systems increasingly support camera-based detection, deep links, and digital wallets. Payment ecosystems such as Alipay, WeChat Pay, PayPal, and regional bank apps have also normalized scanning behavior. Meanwhile, platforms including Bitly, QR Code Generator, Uniqode, Beaconstac, and Flowcode give businesses analytics that were unavailable in the early years of QR campaigns. As a result, QR codes are no longer just scannable graphics; they are measurable entry points into customer journeys.
This article serves as the hub for QR code usage statistics within the broader QR code trends landscape. It explains where growth is coming from, which sectors produce the most scans, what benchmarks matter, and how organizations should use the data to make better decisions. If you need a grounded overview of mobile QR code scanning growth statistics, this is the starting point.
How Fast Mobile QR Code Scanning Is Growing
Mobile QR adoption has expanded quickly because it rides on three established behaviors: using a smartphone camera, tapping a mobile wallet, and expecting instant access to digital content. Industry reporting from companies such as Statista, Juniper Research, and platform providers consistently shows a sharp rise in both QR interactions and consumer familiarity over the past several years. In the United States, consumer adoption lagged Asia for years, but mainstream usage accelerated after 2020 as native camera scanning and touchless experiences became standard. In China, by contrast, QR-based payment and app access had already become deeply embedded in daily life through super-app ecosystems.
Growth should be understood in layers. Total scans show volume. Unique users show reach. Scan frequency shows habit strength. Conversion rate shows commercial value. In campaigns I have audited, teams often celebrate scan spikes without noticing that weak landing pages erase most of the gain. A code on packaging may attract attention, but if the destination page loads slowly or asks for too much data, the scan does not become revenue. That is why strong QR code usage statistics always connect top-of-funnel activity to measurable downstream outcomes.
Another important growth driver is the expansion of scan surfaces. Ten years ago, most codes lived on posters and print materials. Today, they appear on product labels, shelf talkers, restaurant tables, invoices, kiosks, TV screens, delivery boxes, museum placards, utility bills, and direct mail. Each additional surface increases consumer familiarity and lowers behavioral resistance. Once users have scanned for menus, tickets, and payments, scanning a warranty page or loyalty signup feels normal.
Where QR Code Usage Statistics Are Strongest
Not every market uses QR codes in the same way. Usage is strongest where mobile payments, messaging apps, and camera-first behavior are already common. China remains the most mature example, with QR deeply integrated into commerce, transport, social connection, and identity-linked transactions. India has also shown substantial growth, especially through UPI payment flows. Southeast Asia, including Singapore, Thailand, Vietnam, and Indonesia, has seen QR expansion tied to fintech and merchant acceptance. In Europe and North America, adoption is broadening fastest in hospitality, retail, healthcare, and events.
Age matters, but less than many marketers assume. Younger consumers still scan more often, especially in retail promotions and social commerce, yet older users adopted QR quickly when the utility was obvious. I saw this firsthand in healthcare check-in systems and restaurant ordering, where convenience overrode any learning curve. The strongest predictor of scanning is not age alone; it is whether the code promises immediate value. A discount, fast payment, queue skipping, product authentication, or language selection drives action better than generic calls to “scan here.”
Industry-level patterns are also clear. Hospitality uses QR for menus, ordering, reviews, and loyalty enrollment. Retail uses codes for product information, offers, and omnichannel journeys. Healthcare uses them for forms, appointment check-in, prescription information, and patient education. Manufacturing and logistics rely on QR for tracking, maintenance records, and part identification. Media and advertising use them to connect static impressions with measurable digital engagement.
| Sector | Common QR Use Case | Primary Metric | Why It Performs |
|---|---|---|---|
| Restaurants | Digital menus and table ordering | Scans per table | Removes wait time and updates instantly |
| Retail | Product details and promotions | Conversion rate | Bridges packaging to purchase decision |
| Events | Mobile ticketing and check-in | Unique scans | Fast entry and fraud reduction |
| Healthcare | Patient forms and education | Completion rate | Reduces paper and administrative friction |
| Payments | Merchant checkout | Transaction volume | Low-cost acceptance and consumer familiarity |
What the Most Useful QR Metrics Actually Measure
Teams often ask which QR code usage statistics matter most. The answer depends on the goal, but a core measurement set applies almost everywhere. Start with total scans, unique scans, repeat scans, device type, operating system, time of day, geography, and destination performance. Then add conversion metrics tied to the campaign objective: purchases, lead submissions, wallet passes saved, coupons redeemed, app installs, review completions, or video plays. Without that second layer, scan numbers look impressive but say little about business impact.
Dynamic QR codes are especially valuable because they allow destination changes without reprinting the code and provide analytics at the scan level. Static codes still have a place for permanent, low-maintenance uses, but they limit flexibility. In field deployments, I usually recommend dynamic codes for any campaign that may need A/B testing, regional redirects, UTM tagging, or expiration rules. They also help teams separate one code’s performance across packaging runs, store clusters, or media placements.
Context also shapes benchmarks. A QR code on product packaging usually gets fewer scans than one presented at a restaurant table, because the user intent is different. A code shown in a 15-second connected TV ad can produce excellent response if the URL is clear, the creative pauses long enough, and the destination page matches the ad promise. By contrast, tiny codes placed low on billboards often underperform because distance, glare, and motion make scanning impractical.
Why Consumers Scan and Why They Ignore Codes
Consumers scan when they expect speed, utility, or reward. The highest-performing prompts are specific: “See ingredients,” “Pay in seconds,” “Track your package,” or “Get 20% off today.” Vague prompts depress results because they force the user to guess the benefit. Trust signals matter too. Branded destinations, HTTPS pages, and recognizable domains reduce hesitation, especially as awareness of phishing and malicious redirects grows.
Design and placement have outsized effects on scan rates. A working standard is simple: high contrast, quiet zone preserved, code size matched to viewing distance, and a destination optimized for mobile loading. ISO/IEC 18004 defines technical parameters for QR symbology, but practical success depends on execution around the code. I have seen beautiful campaigns fail because the code was distorted to fit a design system or placed on curved reflective packaging that cameras struggled to read.
Post-scan experience is where many programs lose momentum. If the landing page takes more than a few seconds, requires pinching and zooming, or opens with a generic homepage, users drop. Strong QR journeys deep-link to the exact content promised, preserve tracking parameters, and minimize steps. The code should not simply open a website; it should complete a task efficiently.
What Mobile QR Code Scanning Growth Means for Strategy
The strategic lesson from mobile QR code scanning growth statistics is straightforward: QR is no longer an experimental tactic. It is an interface layer between physical environments and digital systems. That changes how businesses should plan campaigns, packaging, retail operations, customer support, and payments. Instead of asking whether to use QR codes, most organizations should ask where the friction in the customer journey is highest and whether scanning can remove it.
For a sub-pillar hub on QR code usage statistics, the most important takeaway is that growth is being sustained by utility, not novelty. Native smartphone support, payment adoption, better analytics, and wider consumer familiarity have made scanning durable across industries. The best-performing programs define a clear value exchange, use dynamic tracking, optimize landing experiences, and judge success by conversions rather than scan volume alone.
If you are building or updating a QR strategy, audit every touchpoint where a customer moves from offline to online. Measure unique scans, repeat behavior, and post-scan outcomes. Then refine creative, placement, and destination experience based on evidence. Mobile QR code scanning growth statistics are telling businesses the same thing: when implemented well, QR codes turn attention into action. Use that signal to guide your next campaign, product launch, or customer journey update.
Frequently Asked Questions
1. Why have mobile QR code scanning statistics grown so quickly in recent years?
Mobile QR code scanning has grown quickly because several adoption barriers disappeared at the same time. The biggest shift was smartphone readiness. Once Apple and Android devices made QR reading available directly through the native camera, users no longer needed to download a separate scanner app. That single improvement removed friction and turned scanning into a fast, familiar action. At the same time, businesses began using QR codes for practical, high-frequency tasks such as restaurant menus, mobile payments, event ticketing, product information, app downloads, authentication, and customer support. In other words, QR codes stopped being a novelty and started solving everyday access problems.
Another major driver was the broader move toward contactless digital experiences. Consumers became more comfortable using their phones to bridge the physical and digital worlds, whether they were checking into a venue, paying at a register, opening a coupon, or viewing instructions on packaging. As more organizations invested in mobile-first customer journeys, QR codes became one of the simplest and lowest-cost tools for connecting offline media with measurable online engagement. That combination of user convenience, widespread camera support, and clear business value explains why mobile QR code scanning statistics now point to sustained mainstream growth rather than a temporary spike.
2. What do mobile QR code scanning growth statistics reveal about consumer behavior?
These statistics generally show that consumers increasingly expect instant access to information and transactions from a physical touchpoint. A QR code turns a poster, label, table tent, storefront window, receipt, billboard, or package into an immediate digital entry point. Instead of typing a long URL, searching for a brand, or downloading an app first, users can simply scan and act. That behavior reflects a larger preference for speed, convenience, and low-effort mobile interactions. When scanning rates rise, it usually signals that people are comfortable letting their smartphones mediate routine decisions in retail, travel, dining, healthcare, education, and public services.
Growth statistics also suggest that scanning is no longer limited to a narrow demographic. Early QR adoption was often concentrated among more tech-forward users, but broader mobile familiarity has expanded usage across age groups and industries. Consumers now use QR codes not only for discovery but also for trust-based actions such as verifying payments, checking authenticity, logging in, joining loyalty programs, and accessing official resources. For marketers and publishers, this means a scan increasingly represents meaningful intent rather than casual curiosity. For institutions and retailers, it shows that mobile engagement can begin at almost any physical surface, making QR-enabled journeys an important part of modern customer behavior.
3. Which industries benefit most from rising mobile QR code scanning adoption?
Retail is one of the biggest beneficiaries because QR codes help connect in-store shopping with digital content. Brands can place codes on shelves, packaging, displays, and receipts to deliver product details, reviews, promotions, reorder links, loyalty enrollment, and post-purchase support. Restaurants and hospitality businesses also gain significant value because QR codes streamline menus, ordering, room information, guest services, and contactless payments. In these environments, fast mobile access improves convenience while reducing operational friction.
Beyond those sectors, publishers, healthcare providers, financial services firms, transportation networks, educational institutions, and government agencies all benefit from QR adoption. Publishers can link print content to articles, videos, subscriptions, and advertiser landing pages. Healthcare organizations can use QR codes for patient forms, appointment check-in, prescription details, and educational resources. Banks and fintech providers often rely on QR codes for secure payment flows and account-linked transactions. Transit systems use them for tickets, schedules, and rider updates, while schools and public institutions use them for enrollment, event access, resource distribution, and wayfinding. The common theme is efficiency: when mobile QR code scanning becomes normal behavior, any organization with physical touchpoints can reduce steps, improve access, and measure engagement more accurately.
4. How should businesses interpret mobile QR code scanning growth statistics for marketing and customer experience strategy?
Businesses should treat rising QR scanning statistics as evidence that offline-to-online conversion is now a standard part of the customer journey. A QR code is no longer just a campaign add-on; it can be a core access layer across packaging, signage, direct mail, print ads, event materials, product inserts, and point-of-sale environments. If scanning adoption is increasing, companies should evaluate where customers currently experience friction and then decide where a QR code can remove steps. That might include linking to product demos, support articles, app installs, promotions, appointment booking, payments, or account actions. The strategic value lies in meeting users at the exact moment of interest.
It is also important to interpret scan growth through a performance lens, not just a trend lens. Businesses should connect QR campaigns to metrics such as unique scans, repeat scans, conversion rate, time of day, device type, location, and downstream actions like purchases or form completions. Dynamic QR codes are especially useful because they allow destination changes and better analytics without reprinting the code itself. However, success depends on execution. Clear calls to action, strong landing page design, mobile optimization, fast load times, and a trusted brand context all influence results. In short, growth statistics suggest opportunity, but the real payoff comes when QR codes are integrated into measurable, well-designed customer experiences.
5. Are there any limitations or risks to consider when evaluating mobile QR code scanning growth statistics?
Yes. Growth statistics are useful, but they need context. A rise in total scans does not always mean every campaign is effective or that every audience is equally engaged. Results can vary widely by geography, industry, age group, use case, and device behavior. For example, QR codes tied to payments or ticketing may have different performance patterns than those used in print advertising or packaging. Businesses should also distinguish between one-time forced adoption and repeat voluntary usage. If people scan because they must access a menu or boarding pass, that does not automatically mean they will engage with every promotional QR code they encounter.
There are also security and trust considerations. Because QR codes can hide a destination URL, users may hesitate to scan unfamiliar codes, especially in public places. Brands should reduce that concern with clear labeling, recognizable domains, and secure landing pages. Poor placement, low print quality, weak contrast, or sending users to a non-mobile-friendly page can also limit performance despite broader market growth. Finally, statistics should be evaluated alongside customer experience data. High scan volume is only valuable if it leads to useful outcomes such as sales, sign-ups, satisfaction, or service efficiency. The best way to read mobile QR code scanning growth data is as a strong indicator of market readiness, while still validating performance through campaign-specific testing and analytics.