QR code consumer behavior statistics reveal how a once-niche scanning tool became a mainstream bridge between physical spaces and digital actions. A QR code, or Quick Response code, is a two-dimensional barcode that stores data such as URLs, contact details, payment credentials, app deep links, or product information. Consumer behavior statistics measure what people actually do with those codes: how often they scan, what prompts them to act, which devices they use, and what outcomes follow. For marketers, retailers, restaurants, healthcare providers, and event operators, these numbers matter because QR performance sits at the intersection of trust, convenience, and mobile intent.
I have worked on QR campaigns across packaging, out-of-home media, and restaurant ordering systems, and the same lesson appears every time: usage rises when the code solves an immediate problem. During the pandemic, many consumers learned QR codes through menus, payments, and contactless check-ins. That period accelerated habit formation, but habit alone does not explain current behavior. Today, consumers scan when the value exchange is obvious, the destination loads quickly, and the brand looks credible. Understanding QR code usage statistics helps teams predict adoption, design better placements, and connect offline touchpoints to measurable online conversions.
This hub article covers the most important patterns within QR code usage statistics, including scan growth, demographic differences, common use cases, conversion drivers, barriers to adoption, and the metrics that actually indicate campaign success. It also explains why QR codes now play a durable role in omnichannel customer journeys. Rather than treating every scan as equal, smart teams examine context: where the code appeared, what promise surrounded it, and whether the experience matched consumer expectations. Those practical details explain the numbers better than trend headlines do.
How Fast QR Code Usage Has Grown
QR code usage statistics consistently show strong growth in scans, users, and campaign volume since 2020. Industry reporting from mobile marketing platforms, payment providers, and consumer surveys broadly agrees on the direction: smartphone-native cameras removed friction, contactless habits normalized scanning, and businesses invested in code-based journeys at scale. In my own campaign reviews, scan rates on retail signage and direct mail rose sharply once brands stopped asking users to download a separate scanner app. That single platform change mattered as much as any creative improvement.
Growth is not uniform across every environment. On-product packaging, in-store displays, restaurant tables, and event badges usually outperform print ads that require a consumer to stop and zoom from a distance. The core reason is intent density. A shopper holding a product is closer to action than someone glancing at a bus shelter. This is why QR code consumer behavior statistics should never be read without placement context. High-growth categories generally share one trait: the code sits near a decision point where information, payment, or verification is immediately useful.
Who Scans QR Codes and Why
Demographic patterns in QR code usage statistics are clearer than many summaries suggest. Younger adults generally scan more often because they are more comfortable with mobile-first transactions, but adoption is now broad enough that age alone is a weak planning variable. Income, urban density, travel frequency, and digital payment familiarity often predict behavior better. For example, commuters routinely scan transit, ticketing, and wallet-linked codes, while shoppers in beauty, electronics, and food categories often use QR codes to compare products, redeem promotions, or access reviews.
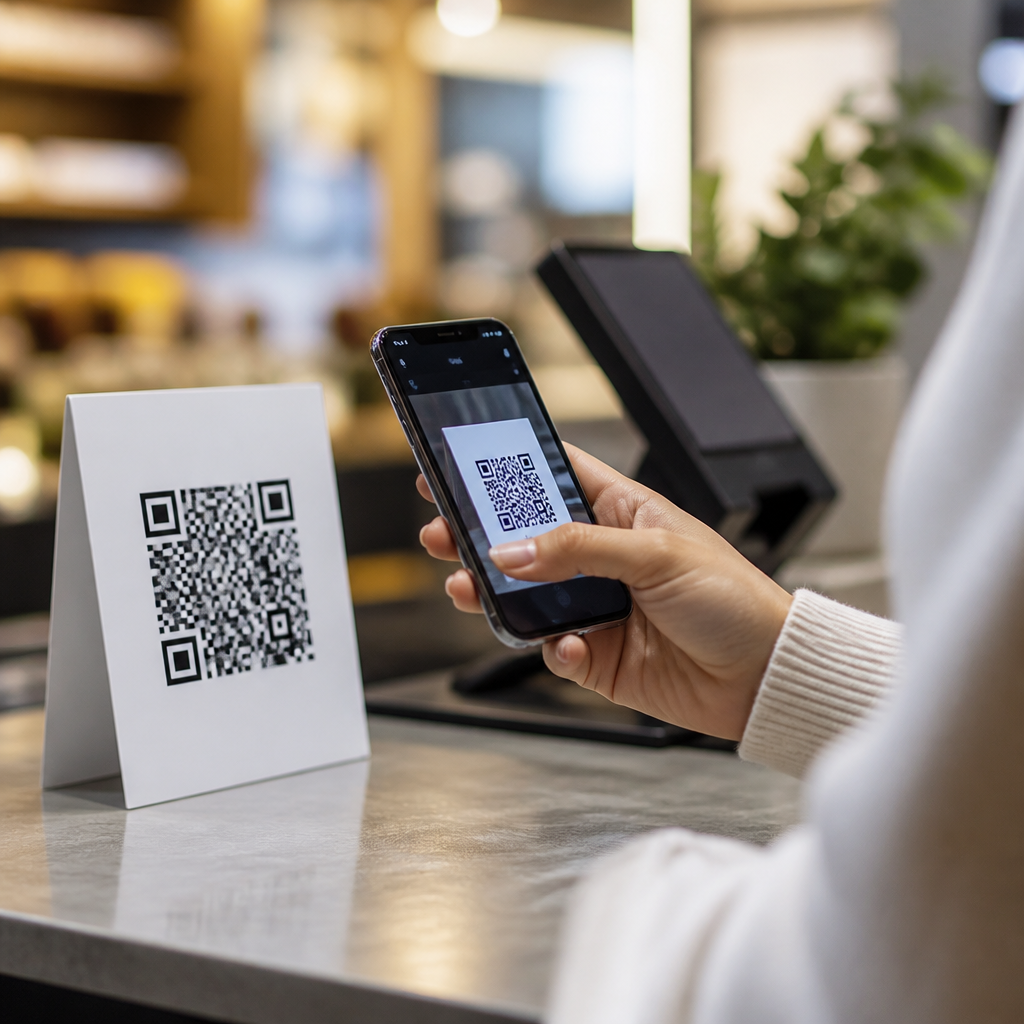
Motivation matters more than novelty. Consumers scan for four practical reasons: to save time, to reduce typing, to receive a reward, or to verify information. A restaurant menu code saves waiting for service. A product code gives ingredients, assembly help, or authenticity details. A payment code reduces card handling. An event code speeds entry. In post-campaign interviews I have run, consumers rarely describe QR codes as exciting technology. They describe them as easy, fast, or useful. That distinction is important because lasting behavior is utility-driven, not trend-driven.
Most Common QR Code Use Cases
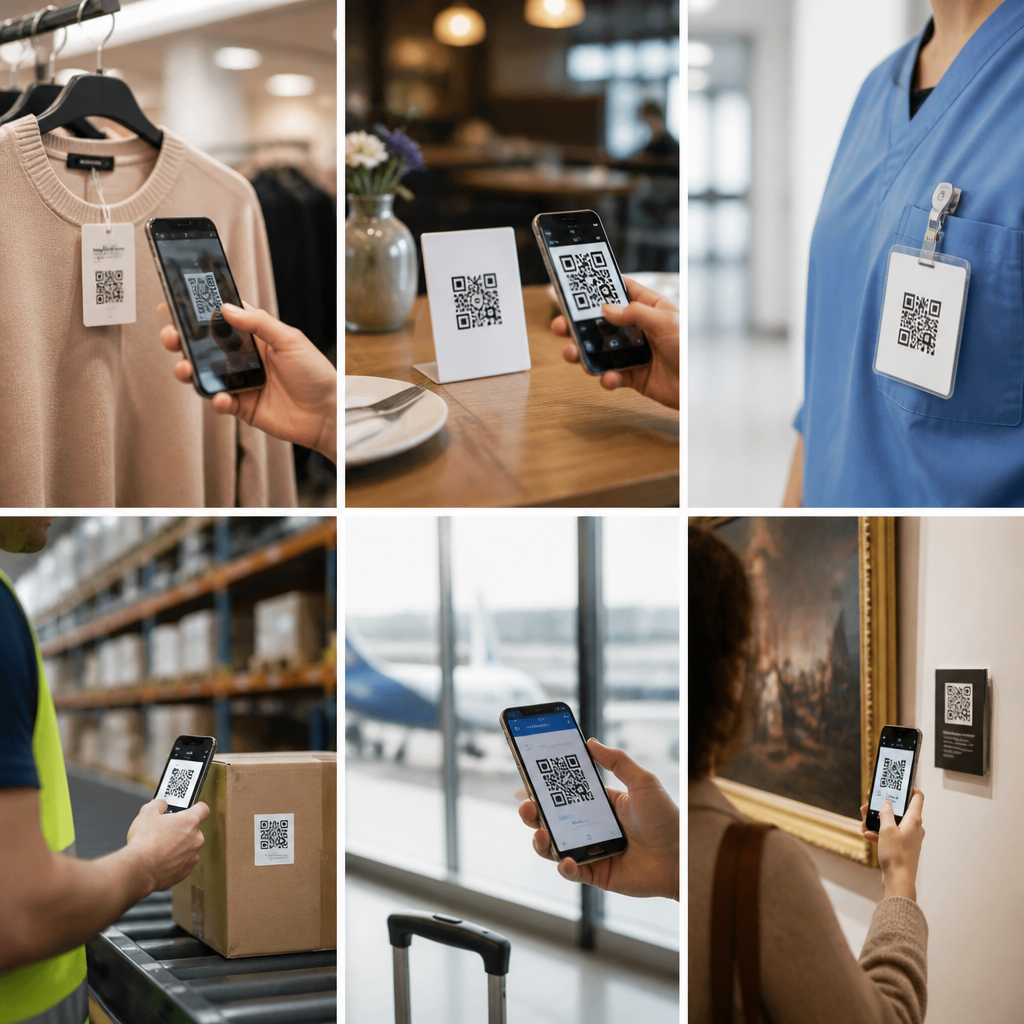
Across industries, the strongest use cases in QR code consumer behavior statistics are menus, payments, product packaging, coupons, event access, app downloads, and authentication. Restaurants use them to route guests to menus and ordering flows. Retail brands place codes on shelves and packaging to surface reviews, specifications, warranty registration, or replenishment options. Consumer packaged goods companies use dynamic QR destinations to update campaigns without changing the printed package. Healthcare organizations deploy them for patient forms, prescription education, and check-in workflows.
Payments deserve special attention because they change the economics of scanning. In markets where wallet ecosystems and bank transfers are mature, payment-related QR codes train consumers to scan as a routine behavior rather than a campaign response. Once that habit exists, adjacent experiences such as loyalty enrollment and receipt capture become easier to adopt. Event organizers see a similar effect. When tickets, schedules, maps, and lead capture all run through codes, users learn that scanning is the fastest path to completion, which raises engagement across the entire journey.
What Drives Higher Scan and Conversion Rates
Successful QR performance depends on visibility, incentive, trust, and landing-page speed. The best-performing codes I have tested always answer one consumer question before the scan happens: what exactly will I get? “Scan to view menu” outperforms “Scan here.” “Scan for 20% off today” outperforms a generic brand code. Clear labeling works because the consumer evaluates effort against expected payoff in seconds. If the payoff is vague, many people simply keep walking.
| Factor | Why it affects behavior | Practical example |
|---|---|---|
| Strong call to action | Reduces uncertainty before scanning | “Scan to compare colors and stock” on shelf tags |
| Relevant placement | Meets the user at a decision moment | Code beside a product, not only at aisle entrance |
| Fast mobile page | Prevents abandonment after the scan | Compressed images and simple forms on landing pages |
| Brand trust signals | Reassures users the destination is legitimate | Logo, branded short link, and secure domain |
| Immediate reward | Increases action and repeat use | Loyalty points, coupons, or instant information |
Technical details influence outcomes more than many teams expect. Error correction level, contrast, print size, scan angle, and ambient lighting all affect readability. A code that is too small on packaging or too reflective on glossy signage can suppress results even when the offer is strong. Dynamic QR platforms such as Bitly, QR Code Generator, and Uniqode help teams track scans by time, device, and geography, but analytics only matter if the physical execution is sound. Poor print production can erase the gains from excellent targeting.
Where Consumer Friction Still Appears
Despite strong adoption, QR code usage statistics also reveal persistent friction points. Some consumers worry about malicious redirects, especially when scanning codes on public posters or unfamiliar products. Others abandon after scanning because the page asks for too much information, loads slowly, or is not mobile optimized. I regularly see brands celebrate scan volume while ignoring downstream drop-off, even though the real failure happened after the camera opened the link. A scan is interest, not success.
Accessibility and environment matter as well. Older devices may struggle in low light. Some users have limited data service in stores, stadiums, or transit hubs. Small print and weak color contrast reduce usability for many audiences. International campaigns also face market-specific behavior differences. In some regions, QR payments and super apps make scanning instinctive; in others, email capture, app download, or coupon redemption remain the dominant objectives. Any serious reading of consumer behavior statistics must account for these operational realities rather than treating the channel as universally frictionless.
How Businesses Should Measure QR Code Usage Statistics
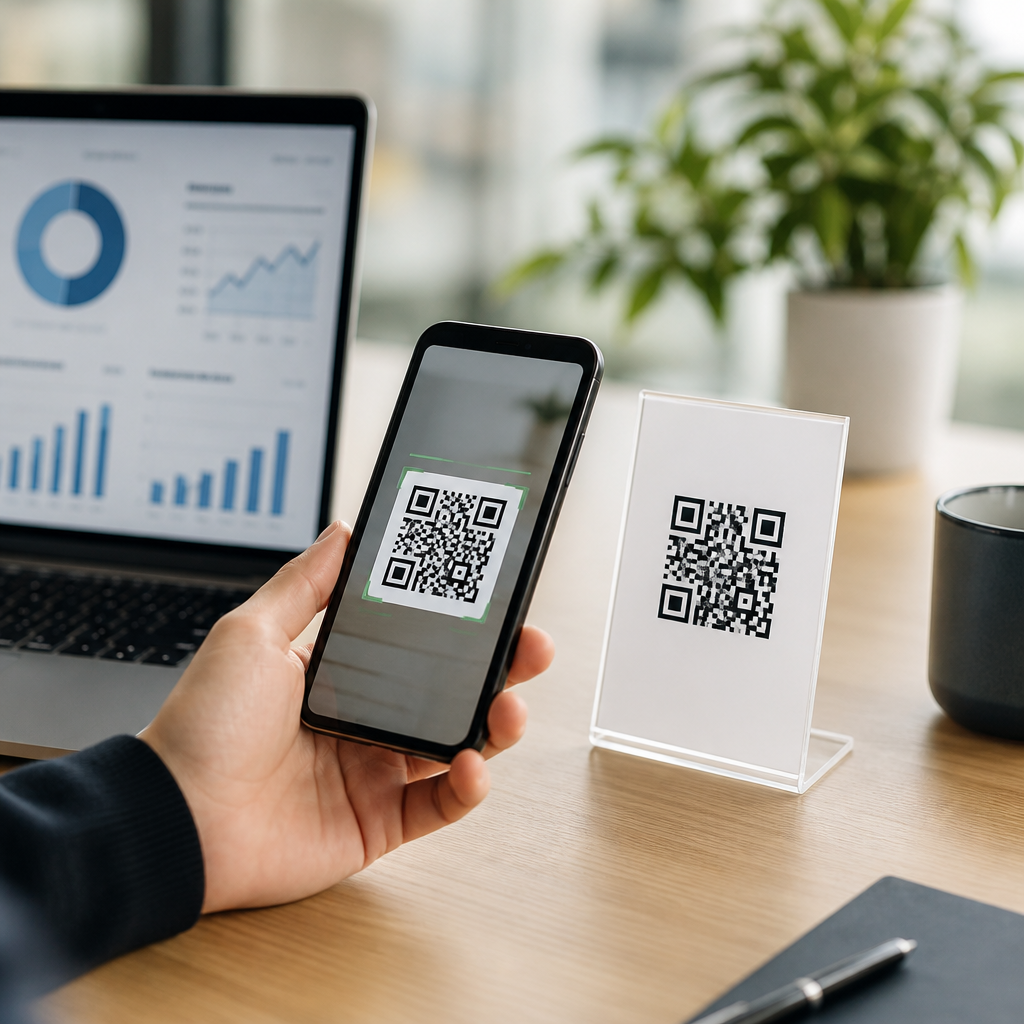
The most useful QR code usage statistics go beyond total scans. Teams should separate unique scans from repeat scans, because repeat activity can indicate either healthy engagement or confusion. They should compare scan-through rate by placement, creative, and call to action. They should measure bounce rate, dwell time, conversion rate, form completion, add-to-cart rate, payment completion, and assisted conversions in analytics platforms such as Google Analytics 4 or Adobe Analytics. Where possible, use UTM parameters and dynamic destinations so offline placements can be evaluated like digital campaigns.
Benchmarking should also reflect the business model. A product package code that drives ingredient lookup will not convert like a coupon code at checkout, and it should not be judged by the same standard. For a restaurant menu QR code, success may mean reduced wait times and higher table turns. For a B2B trade show booth, it may mean qualified lead capture tied to CRM progression. The best hub metrics combine efficiency and outcome: scans per thousand impressions, cost per scan, landing-page completion, and revenue or operational savings generated per placement.
What the Statistics Suggest About the Future
QR code consumer behavior statistics point to durable, not temporary, adoption. Consumers now expect frictionless transitions from physical media to digital experiences, and QR codes remain the lowest-cost universal mechanism for making that jump. Near field communication, digital wallets, and visual search will continue to grow, but QR codes keep a major advantage: they are cheap to print, easy to update through dynamic routing, and understood across industries. That combination makes them resilient.
Going forward, the strongest gains will come from better destination design, richer first-party data strategies, and smarter integration with loyalty, payment, and product traceability systems. Brands that treat QR as infrastructure rather than decoration will win. Audit your current placements, clarify the value proposition on every code, and track what happens after the scan. That is how QR code usage statistics become practical growth signals instead of vanity metrics.
Frequently Asked Questions
What do QR code consumer behavior statistics actually measure?
QR code consumer behavior statistics track the real actions people take before, during, and after scanning a QR code. That includes scan frequency, device type, operating system, location, time of day, campaign source, and what users do once they land on the destination page. In practical terms, these statistics help explain whether consumers are scanning codes on product packaging, in restaurants, on posters, in stores, at events, or through direct mail, and whether those scans lead to meaningful outcomes such as purchases, sign-ups, downloads, menu views, contact saves, or payment completions.
These statistics also measure motivation and friction. For example, they can reveal whether consumers are more likely to scan a code when they expect a discount, fast information access, contactless service, loyalty rewards, or exclusive content. At the same time, behavior data can expose barriers such as poor code placement, lack of trust, weak internet access, or landing pages that are not mobile-friendly. In short, QR code consumer behavior statistics do not just show that a scan happened; they show how people interact with the full experience and what makes that interaction successful or unsuccessful.
Why have QR codes become so widely adopted by consumers?
QR codes became mainstream because they solve a convenience problem in a way that fits modern mobile behavior. Consumers already carry smartphones, and most devices now scan QR codes instantly through the native camera app without requiring a separate download. That removed a major adoption barrier and turned QR codes into a fast bridge between offline attention and online action. Instead of typing a long URL, searching for a product, or entering payment details manually, users can scan once and arrive exactly where they need to go.
Wider adoption was also accelerated by changes in consumer expectations. People increasingly want low-friction, self-service, mobile-first experiences. QR codes support that behavior across many use cases, including digital menus, mobile payments, app downloads, event check-ins, product authentication, instructional content, and promotional offers. As consumers became more familiar with seeing codes in everyday environments, trust and scan willingness increased. The result is that QR codes moved from being seen as a novelty to becoming a standard interaction tool, and consumer behavior statistics reflect that shift through higher scan rates, broader demographic usage, and more diverse conversion outcomes.
What factors most influence whether a consumer decides to scan a QR code?
Consumers are most likely to scan a QR code when the value is clear, immediate, and relevant. The strongest driver is a visible reason to act, such as “scan to save,” “scan to view menu,” “scan for product details,” or “scan to pay.” Clear calls to action consistently outperform codes presented without context because users want to know what will happen before they commit. Placement also matters significantly. A code must be easy to notice, easy to physically scan, and positioned where a user has enough time and space to interact with it comfortably.
Trust is another major factor. Consumers are more willing to scan codes from recognized brands, professional displays, secure retail environments, and materials that look legitimate and well-designed. If a code appears random, damaged, poorly printed, or unsupported by surrounding information, scan intent drops. Technical execution plays an equally important role. Codes need proper sizing, contrast, and destination optimization for mobile devices. A fast-loading landing page, concise content, and a smooth next step can improve conversion rates dramatically. Consumer behavior statistics often show that scan interest and post-scan engagement are closely linked, meaning the decision to scan is influenced not only by the code itself but also by the quality of the experience users expect to receive.
How do businesses use QR code consumer behavior statistics to improve marketing and customer experience?
Businesses use QR code consumer behavior statistics to understand how offline materials contribute to digital engagement and revenue. By tracking where scans occur, which assets perform best, and what actions users take afterward, marketers can evaluate the effectiveness of packaging, signage, print ads, in-store displays, receipts, table tents, mailers, and event collateral. If one campaign placement generates many scans but few conversions, that suggests a disconnect between user intent and landing page experience. If another placement produces fewer scans but a much higher purchase rate, it may indicate a stronger audience fit or a more compelling offer.
These insights help businesses make better decisions across design, messaging, placement, and audience targeting. They can test different calls to action, compare locations, personalize post-scan pages, and segment performance by device or time period. Beyond marketing, customer experience teams use QR code data to streamline service interactions, such as reducing wait times, simplifying ordering, delivering support content, or offering contactless account access. The most effective organizations treat QR code behavior statistics as more than vanity metrics. They use them to optimize the full customer journey, from initial scan to final action, and to identify where convenience, trust, and relevance can be improved.
What should readers keep in mind when interpreting QR code consumer behavior statistics?
QR code statistics are most useful when interpreted in context. A high scan count may look impressive, but it does not automatically mean strong performance. What matters is who scanned, why they scanned, and what happened next. A campaign aimed at awareness may prioritize reach and engagement, while a retail promotion may focus on conversions, coupon redemptions, or completed checkouts. Without understanding the objective, raw scan volume can be misleading. Readers should also consider variables such as audience demographics, industry, placement environment, seasonality, incentive strength, and mobile usability.
It is also important to distinguish between curiosity and intent. Some scans happen because a code is novel or highly visible, while others come from consumers who are ready to buy, register, or pay. Strong analysis looks at downstream behavior such as bounce rate, session duration, repeat visits, and conversion rate rather than scans alone. In addition, privacy standards, attribution methods, and analytics setups can affect what is measured and how reliably it is reported. The best reading of QR code consumer behavior statistics combines quantitative metrics with practical understanding of user experience, campaign design, and consumer psychology. That broader view gives a more accurate picture of how QR codes influence modern customer behavior.