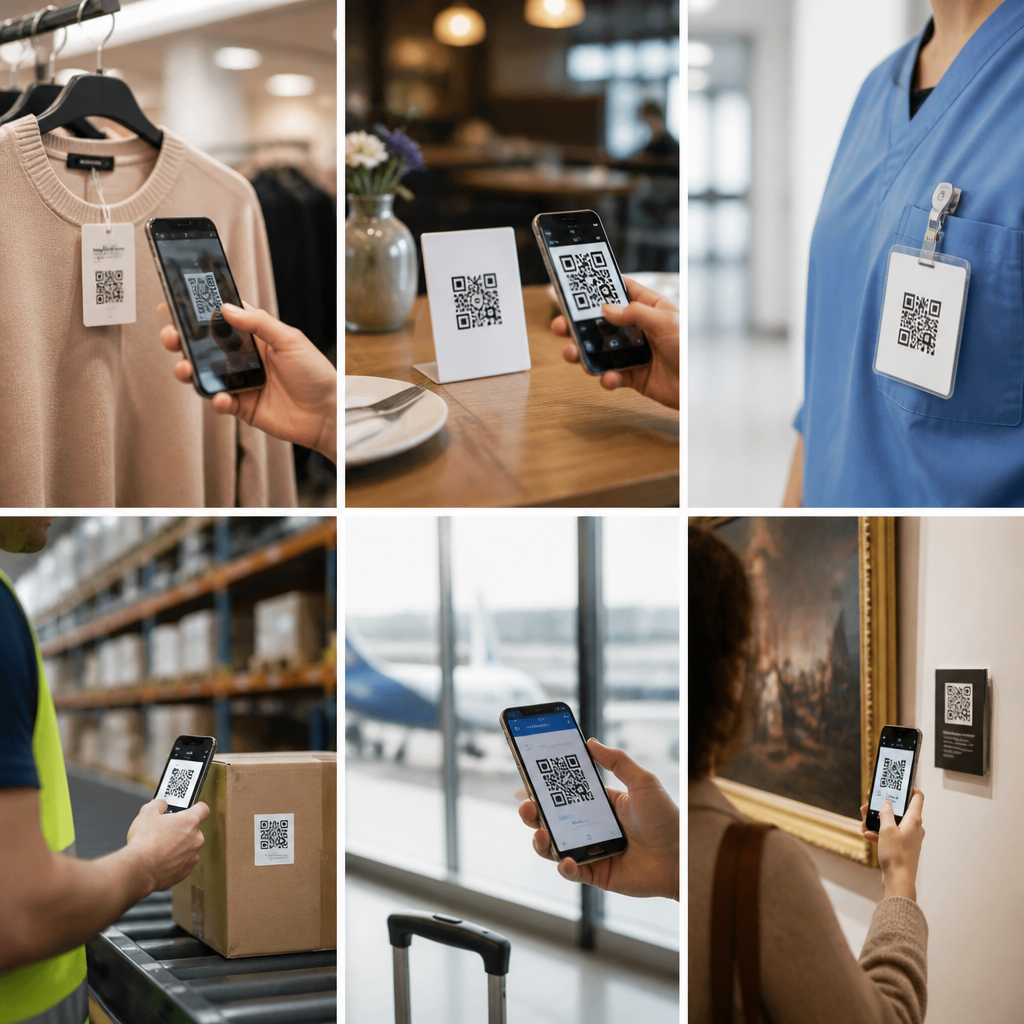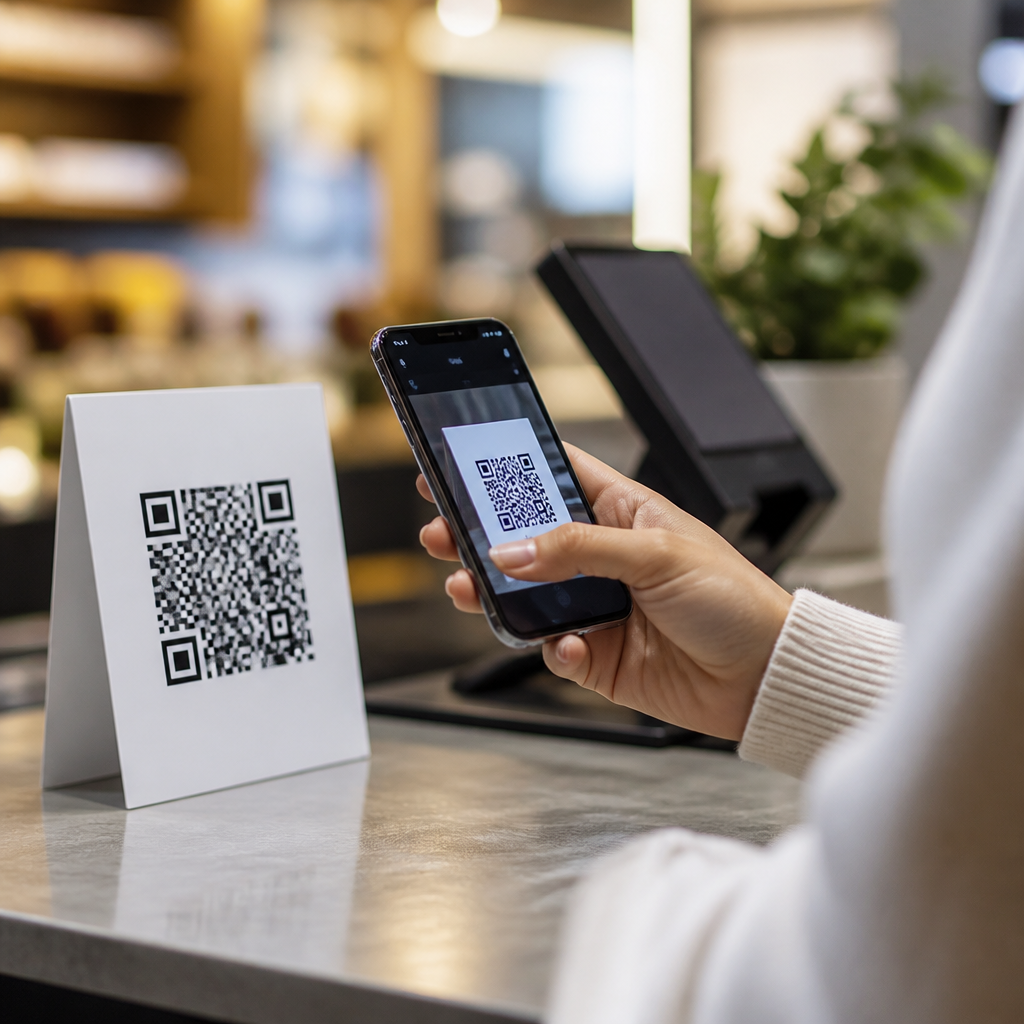
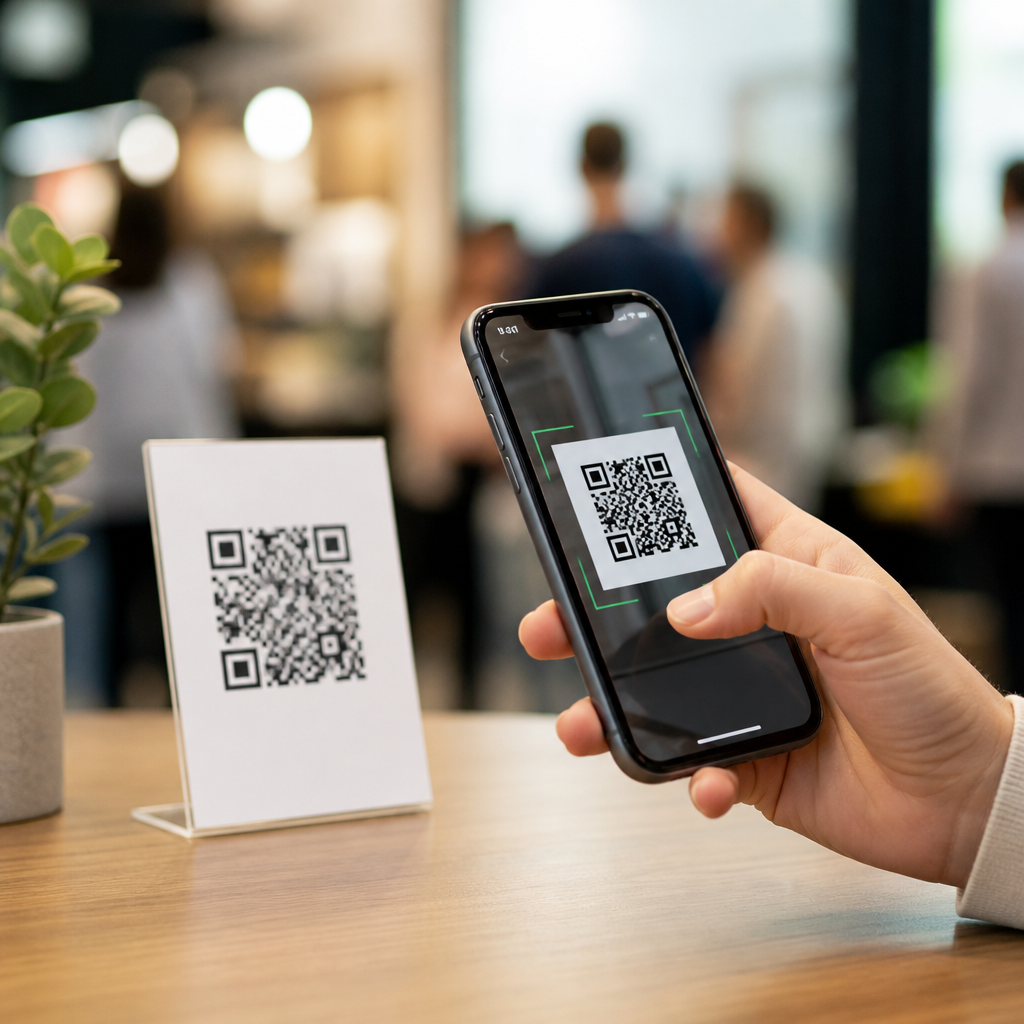
QR code scan rate benchmarks by industry reveal how often people move from seeing a code to taking action, and that number has become one of the clearest indicators of campaign relevance, placement quality, and mobile readiness. A QR code scan rate is the percentage of viewers, recipients, visitors, or buyers who scan a code after encountering it in a defined context such as product packaging, direct mail, restaurant menus, event signage, retail displays, invoices, or outdoor advertising. In practice, I measure scan rate against a realistic denominator: impressions for signage, delivered pieces for print mail, transactions for receipts, or units sold for packaging. That distinction matters because a “good” scan rate for a pharmacy handout is not the same as a “good” scan rate for a stadium banner.
Interest in QR code usage statistics accelerated after smartphone cameras made native scanning universal on iPhone and Android devices and after touchless interactions normalized QR behavior globally. The result is a channel that bridges offline attention and digital conversion with unusually precise tracking. Marketers, operators, and product teams use scan data to answer practical questions: Which store posters drive engagement, which package design encourages repeat use, what incentive changes response, and where does mobile friction suppress performance? Scan benchmarks matter because they prevent bad decisions. Without industry context, a 3 percent scan rate might look weak when it is excellent for packaging, or a 12 percent rate might seem strong when it is underperforming for a table tent with an instant discount.
As a hub for QR code usage statistics, this article explains how to benchmark scan rates by industry, what variables move results up or down, and how to interpret performance without confusing scans with conversions. It also maps the subtopics teams usually need next, including packaging engagement, direct mail response, menu replacement, event lead capture, retail omnichannel use, and the privacy limits of QR analytics. The goal is simple: give you realistic ranges, the reasons behind them, and a practical framework for improving results.
What Counts as a QR Code Scan Rate
A QR code scan rate should always tie a scan count to exposure in the real world. For a poster campaign, the denominator may be estimated foot traffic adjusted for viewability. For a postcard, it is usually delivered pieces. For packaging, many teams use units sold, not units printed, because only purchased items have a meaningful chance to be scanned. I have seen reporting errors inflate success simply because a team divided scans by website visits or total campaign reach instead of by the people who actually encountered the code.
Use unique dynamic QR codes for each placement, campaign, and creative variation. Static codes are fine for fixed destinations, but they limit measurement. Dynamic platforms such as Bitly, QR Code Generator PRO, Flowcode, and Uniqode let teams update destination URLs, add UTM parameters, and compare scan volume by date, device, geography, and time of day. If the landing page does not load fast, is not mobile optimized, or asks for too much too soon, scans may look healthy while business outcomes remain weak. That is why scan rate is a top-of-funnel benchmark, not a complete verdict on campaign value.
Typical QR Code Scan Rate Benchmarks by Industry
Industry benchmarks vary because user intent, dwell time, trust, and incentive vary. A diner seated at a restaurant table has high attention and a clear reason to scan. A commuter passing an outdoor billboard at speed does not. Based on campaign audits, vendor case studies, retail field data, and mobile response patterns, the ranges below are practical benchmarks for modern smartphone audiences using visible calls to action and working landing pages.
| Industry or Use Case | Typical Scan Rate Range | Why the Range Looks This Way |
|---|---|---|
| Restaurants and hospitality | 15% to 35% | High dwell time, immediate utility for menus, ordering, loyalty, and payment |
| Consumer packaged goods | 0.5% to 3% | Low friction to see code, but many buyers have limited post-purchase motivation |
| Retail in-store signage | 2% to 10% | Works best when tied to reviews, product details, size availability, or coupons |
| Direct mail | 3% to 12% | Highly dependent on list quality, offer strength, and creative clarity |
| Events and trade shows | 20% to 45% | Attendees expect badge scans, session downloads, maps, and lead capture |
| Healthcare and patient communications | 4% to 15% | Trust and utility are high, but compliance language can add friction |
| Real estate signage | 1% to 8% | Location and listing quality matter more than code design alone |
| Outdoor advertising | 0.1% to 2% | Distance, motion, weather, and short viewing windows depress response |
These ranges assume the code is easy to scan, large enough for the setting, and paired with a direct instruction. “Scan to see ingredients,” “scan for same-day pricing,” and “scan to claim 10% off” outperform vague prompts like “learn more.” In every category, the upper end of the range usually requires a clear immediate reward.
Why Restaurants, Events, and Direct Mail Often Lead
Restaurants consistently produce strong QR scan rates because the code solves an immediate task. Guests need a menu, want to pay, or want to join loyalty. During menu digitization projects, I saw table-based QR codes outperform window decals by a wide margin because customers had time, context, and intent after sitting down. Hospitality also benefits from repeat exposure. A hotel room placard can invite scans for Wi-Fi access, late checkout, room service, or local recommendations, creating multiple opportunities across a single stay.
Events and trade shows also scan well because attendees are already in information-gathering mode. Session signage, exhibitor booths, and badges naturally support QR behavior. Good operators use separate codes for agenda downloads, booth lead forms, and post-session resources instead of routing everything through one generic page. That structure improves both attribution and attendee experience.
Direct mail remains stronger than many digital-only marketers expect. A postcard with a personalized offer and a prominent QR code can outperform a plain vanity URL because the camera removes typing friction. USPS promotions have periodically encouraged the integration of mobile technologies in mailpieces, reinforcing QR as a practical response tool rather than a novelty. The caveat is list quality: weak targeting can cut scan rate dramatically even when design is polished.
Why Packaging, Retail, and Outdoor Require Different Expectations
Consumer packaged goods often generate modest scan rates because the code competes with routine buying behavior. Many shoppers just want the product and move on. Packaging codes perform best when they unlock utility that cannot fit on the label: recipe ideas, authentication, how-to video, warranty registration, sustainability sourcing, or loyalty rewards. Beauty, supplements, wine, and electronics accessories often outperform commodity grocery categories because shoppers seek more information or guidance.
Retail in-store signage sits in the middle. Scan rates rise when the code resolves a known gap, such as missing sizes, product comparisons, customer reviews, assembly instructions, or stock checks for nearby locations. A code on a shelf talker that merely sends people to the homepage will disappoint. I have seen stores lift scans simply by changing destination pages from broad category listings to product-specific pages with inventory status and pickup options.
Outdoor advertising usually posts the lowest rates, not because QR codes fail, but because the medium limits action. Drivers cannot safely scan, pedestrians move quickly, and distance hurts readability. Better-performing placements include transit shelters, elevator screens, and queue areas where people are stationary. For billboards and street posters, large code size, short scan distance, and a very clear payoff are essential.
What Factors Most Strongly Change Scan Rates
Five variables explain most performance swings. First is intent: the stronger the immediate need, the higher the scan rate. Second is friction: poor mobile pages, weak connectivity, small codes, or low contrast suppress scans. Third is incentive: discounts, exclusive information, and convenience all raise response. Fourth is trust: healthcare, finance, and regulated products need brand clarity and secure destinations. Fifth is placement context: a code seen while seated behaves differently from one seen while walking.
Technical execution matters more than many teams realize. Use sufficient quiet zone around the code, maintain contrast, and test at real-world distance and lighting. QR experts generally recommend sizing based on scan distance, often near a 10:1 ratio, meaning a code viewed from ten inches should be roughly one inch wide. Error correction helps when logos or print damage are involved, but over-stylizing can hurt readability. ISO/IEC 18004 remains the core standard behind QR code structure, and respecting that standard improves reliability.
How to Benchmark and Improve Your Own Results
Start by segmenting scans by use case, not by company-wide average. A retailer should separate shelf tags, window posters, receipts, packaging inserts, and direct mail because each has different exposure conditions. Next, track scan-through to downstream metrics such as engaged sessions, form completions, coupon redemptions, purchases, or account creation. A higher scan rate is not always better if it brings low-intent traffic that does not convert.
Run controlled tests with one variable at a time. Compare incentive versus no incentive, product page versus category page, black-and-white versus branded design, or “scan to order” versus “scan to compare sizes.” In practice, the fastest gains usually come from clearer calls to action, stronger destination relevance, and better placement height. Internal content hubs should connect packaging, retail, restaurant, healthcare, and event articles so readers can go deeper into each benchmark category and related QR code usage statistics.
QR code scan rate benchmarks by industry are useful because they replace guesswork with grounded expectations. Restaurants, events, and direct mail generally lead because they align scanning with immediate intent and low friction. Packaging, retail, and outdoor can still perform well, but only when the code delivers clear value in the moment and the mobile journey is tightly matched to context. The best benchmark is never a vanity average; it is a range tied to your channel, audience, and exposure conditions.
If you manage QR campaigns, audit every placement, assign unique dynamic codes, and compare your performance against the right industry range before changing creative or spend. Then improve the basics: visible placement, explicit benefit, fast landing page, and precise tracking. Do that consistently, and your QR code usage statistics will become far more actionable than raw scan counts alone.
Frequently Asked Questions
What is a QR code scan rate, and how is it calculated?
A QR code scan rate measures the percentage of people who scan a QR code after being exposed to it in a specific setting. It is one of the most practical ways to evaluate whether a QR-driven campaign is actually motivating action. The basic formula is simple: divide the number of unique scans by the number of impressions, recipients, visitors, or eligible viewers, then multiply by 100. For example, if a direct mail piece reaches 10,000 households and 600 unique recipients scan the code, the scan rate is 6%.
What makes this metric especially useful is that it connects visibility to response. A QR code may be technically functional and visually prominent, but if the scan rate is weak, that often signals a problem with message relevance, incentive strength, placement, timing, or mobile landing page quality. In other words, scan rate is not just a measure of code usage; it is a signal of campaign effectiveness.
It is important to define the denominator carefully. In a retail environment, you might compare scans to store foot traffic or product unit sales. In packaging, you may compare scans to units shipped or purchased. In restaurant settings, scans may be measured against table count, guest volume, or menu impressions. Without a clearly defined exposure base, benchmark comparisons become unreliable. That is why industry-specific scan rate benchmarks are more meaningful than broad averages, because the context of exposure strongly affects how likely someone is to scan.
Why do QR code scan rate benchmarks vary so much by industry?
QR code scan rate benchmarks vary by industry because the user’s intent, environment, urgency, and trust level change dramatically from one context to another. A customer scanning a code on product packaging has different motivations than an attendee scanning event signage or a patient scanning a healthcare handout. Some industries present QR codes at moments of high engagement, while others place them in low-attention or high-friction environments.
For example, restaurant QR codes often benefit from immediate utility. If a diner needs a menu, payment option, loyalty offer, or ordering flow, the reason to scan is clear and immediate. By contrast, a billboard or transit poster may generate lower scan rates simply because the viewer is moving, distracted, or not in a convenient position to take out a phone. That does not necessarily mean the campaign is poor; it means the context is less scan-friendly.
Industry benchmarks also shift based on audience familiarity and mobile behavior. Retail shoppers, event attendees, and younger digital-first consumers may be more comfortable scanning codes than audiences in regulated or trust-sensitive categories. In sectors such as finance, insurance, or healthcare, users may hesitate unless the purpose is explicit and the source feels credible. The benchmark must therefore reflect both the channel and the audience.
Another major factor is incentive design. A packaging QR code linked to setup instructions or exclusive content may perform differently from one linked to a generic homepage. A direct mail QR code offering a personalized discount can outperform a code that simply says “learn more.” Benchmarks by industry are useful because they frame performance expectations realistically, but the best interpretation always considers the specific use case, audience, and call to action.
What is considered a good QR code scan rate?
A good QR code scan rate is relative to placement, audience intent, and industry norms, which is why benchmark analysis matters. There is no universal percentage that defines success across every campaign. A scan rate that looks excellent for outdoor advertising might be disappointing for direct mail or event badges. The right question is not only “Is this rate high?” but also “Is this rate strong for this type of exposure and business objective?”
In general, high-intent placements tend to produce better scan rates than passive awareness placements. Product packaging, table-service menus, receipts, event check-in materials, and personalized mailers often have more favorable conditions for scanning because the user has time, context, and a reason to act. Lower-intent placements such as storefront posters, window decals, or mass out-of-home media may produce more modest rates but still deliver value through broad reach and incremental engagement.
A good scan rate also depends on what happens after the scan. A code that generates fewer scans but leads to strong conversions, sign-ups, purchases, or downloads may outperform a higher-scan campaign with weak downstream results. That is why sophisticated marketers look at scan rate alongside landing page conversion rate, bounce rate, time on page, and completion metrics. A strong benchmark is useful, but scan quality matters as much as scan quantity.
The most reliable way to judge performance is to compare your results against similar campaigns in the same industry and then track internal improvement over time. If your retail display scan rate is above prior campaigns and paired with healthy conversions, it may be performing very well even if it differs from another industry’s average. Good performance is contextual, repeatable, and aligned with business outcomes.
What factors have the biggest impact on improving QR code scan rates?
The biggest drivers of QR code scan rate are placement quality, clarity of the call to action, perceived value, and mobile experience. People rarely scan just because a code exists. They scan when the purpose is obvious, the next step feels worth their time, and the experience appears safe and easy. That means optimization starts well before analytics and continues after the scan.
Placement matters first. A QR code should be visible, accessible, and positioned where the user has enough time and physical ability to scan. Codes placed too high, too small, behind reflective surfaces, in poor lighting, or in motion-heavy settings typically underperform. Size, contrast, white space, and scan distance all influence usability. In industries such as retail, hospitality, and events, small design adjustments can materially lift scan rates.
The call to action is equally important. Generic prompts like “scan here” are usually weaker than specific value-based messaging such as “Scan to view the menu,” “Scan for setup instructions,” “Scan to claim your offer,” or “Scan to book instantly.” The clearer the benefit, the better the response tends to be. This is especially true in competitive environments where attention is limited and the user needs an immediate reason to engage.
Landing page quality is another major factor. If the post-scan experience is slow, confusing, non-mobile-friendly, or mismatched to the promise on the code, users drop off quickly and future willingness to scan may decline. Strong-performing campaigns usually send visitors to mobile-optimized pages with fast load times, clear next steps, and message continuity. Finally, trust cues matter. Branded design, recognizable domains, concise instructions, and transparent intent all reduce hesitation and can improve scan behavior across industries.
How should businesses use QR code scan rate benchmarks to evaluate campaigns more accurately?
Businesses should use QR code scan rate benchmarks as a directional performance tool, not as a standalone verdict. The most effective approach is to compare campaigns within the same industry, same channel, and similar audience conditions. A packaging benchmark should not be evaluated the same way as a direct mail benchmark, and a restaurant menu campaign should not be judged against outdoor advertising. Accurate analysis begins with apples-to-apples comparisons.
It also helps to segment results by placement, audience type, geography, device behavior, and campaign objective. A single blended scan rate can hide meaningful differences. For instance, one retail code may perform exceptionally in endcap displays but poorly on shelf talkers. One mail segment may respond better than another because of stronger offer relevance. By isolating variables, businesses can identify what is actually driving performance and improve future execution with confidence.
Benchmarks become even more useful when paired with trend analysis. If an industry average suggests a campaign is in a normal range, that is helpful, but internal benchmarking often matters more. If your scan rate improves from quarter to quarter after changes in design, CTA language, or landing page flow, that is a strong indicator of progress. Likewise, if scans rise but conversions fall, the issue may be post-scan friction rather than poor code visibility.
Ultimately, the best use of QR code scan rate benchmarks is to support smarter decision-making. They help businesses diagnose whether performance issues stem from weak creative, poor placement, low audience relevance, or mobile experience problems. They also provide a realistic framework for setting goals, forecasting results, and prioritizing optimization. Used correctly, scan rate benchmarks by industry do not just measure engagement; they help explain why engagement happens and how to improve it.