QR code engagement statistics reveal how a once niche tool became a mainstream bridge between physical spaces and digital actions. A QR code, or quick response code, is a two dimensional barcode that a smartphone camera can scan to open a website, download an app, view a menu, pay a bill, save contact information, or trigger another predefined action. When marketers, retailers, restaurants, healthcare providers, and logistics teams talk about engagement, they usually mean measurable activity after the scan: visits, signups, purchases, form submissions, coupon redemptions, or repeat interactions. Understanding QR code usage statistics matters because the code itself is not the goal; business value comes from what happens after the scan.
In practice, I have seen teams overestimate scans and underestimate intent. A poster in a train station may generate thousands of scans but few conversions if the landing page loads slowly or asks for too much information. By contrast, a product package with a clear benefit such as warranty registration or assembly instructions can generate fewer scans yet higher completion rates. That is why a strong statistical view must separate exposure, scans, unique users, engagement depth, conversion rate, time of day, device type, and returning behavior. This article serves as a hub for QR code usage statistics, explaining where adoption is strongest, what metrics matter most, and how to interpret the numbers responsibly.
Several macro forces explain the rise in QR activity. Smartphone camera apps now support native scanning on both iOS and Android, removing the old friction of downloading a dedicated scanner. Contactless behavior accelerated during the pandemic, especially in restaurants, payments, check in flows, and healthcare forms. At the same time, dynamic QR platforms made it easier to update destinations without reprinting codes, enabling campaigns with proper analytics, UTM tagging, and A/B testing. As a result, QR code engagement statistics are no longer side notes in campaign reports. They are now core indicators for offline to online attribution, customer journey design, and local conversion analysis.
Adoption Growth and What the Headline Numbers Really Mean
QR code usage statistics consistently show broad consumer familiarity, but the best interpretation comes from separating access from action. Access means a user can scan a code with a standard phone camera. Action means the user chooses to do it in a specific context. Industry reporting from major publishers, payments firms, and analytics platforms has shown steady year over year growth in scans, especially after 2020. The strongest growth segments have included restaurant ordering, mobile payments, retail packaging, event ticketing, and direct mail. In my campaign work, the highest lift usually appears where the code removes friction from an already motivated task, not where it tries to create interest from zero.
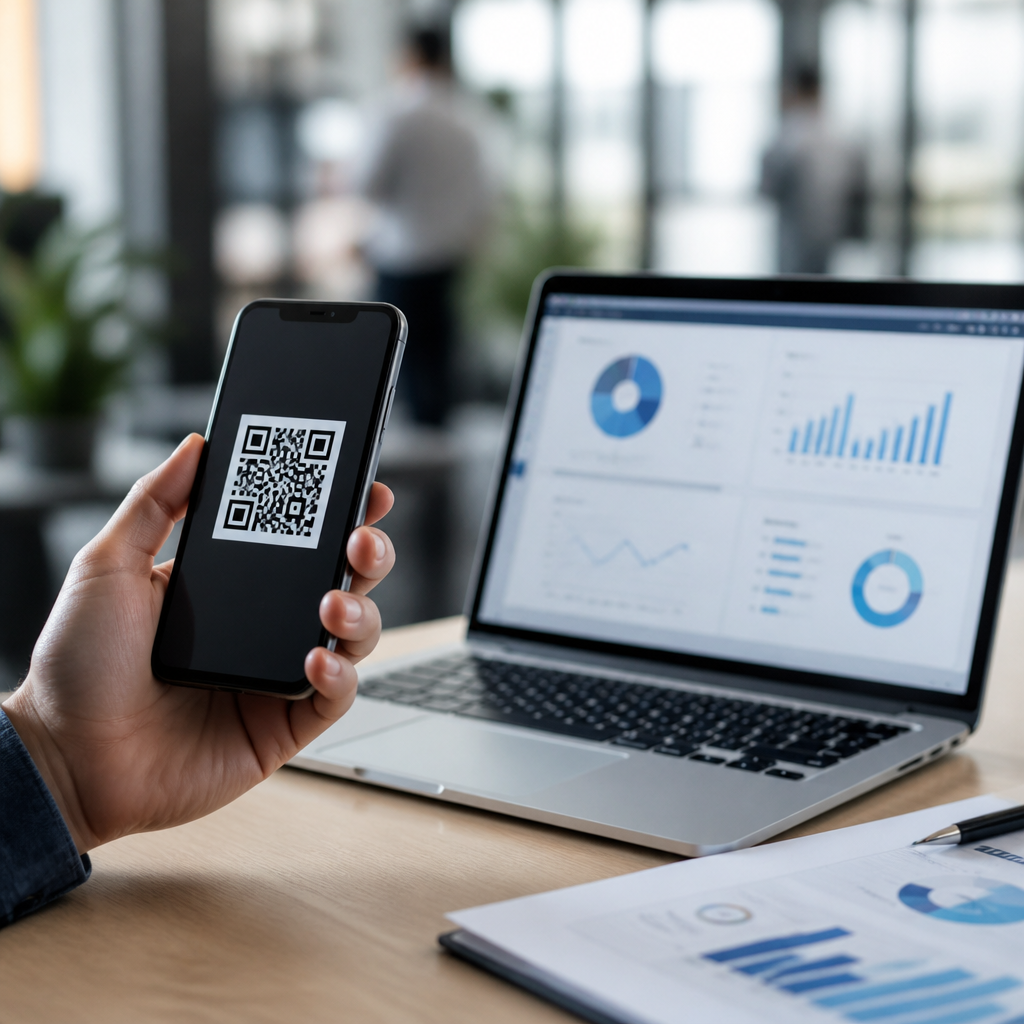
One reason headline adoption figures can mislead is that total scans do not equal total users. A single user may scan multiple times across devices or sessions. Another issue is low quality placement. A code printed too small, placed behind glare, or shown briefly on a screen can inflate impressions but depress actual scan rate. Good QR code engagement statistics therefore pair volume with context: scan through rate from a known audience, unique scans, completion rate after load, and assisted conversions in analytics tools such as Google Analytics 4, Adobe Analytics, or Mixpanel. When those numbers are aligned, decision makers can see whether a code is merely visible or truly useful.
Where QR Codes Perform Best Across Industries
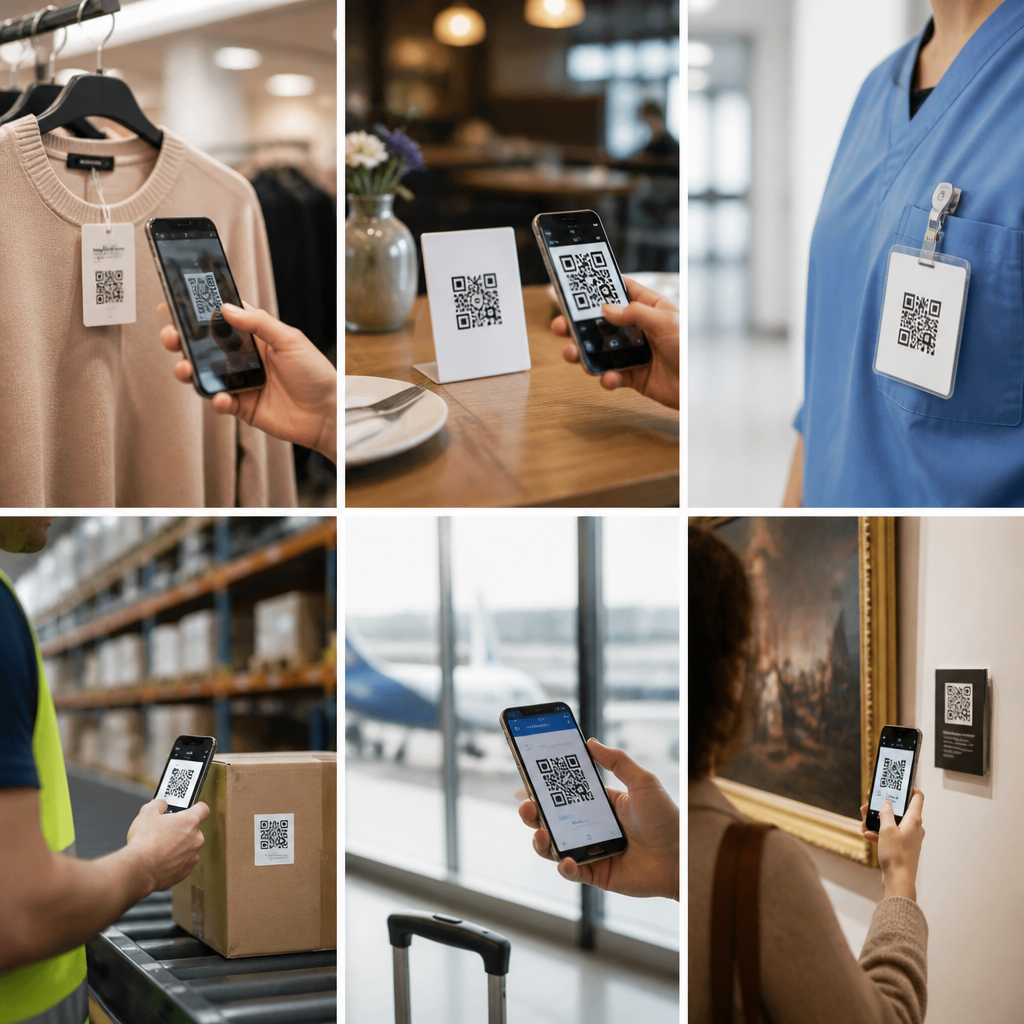
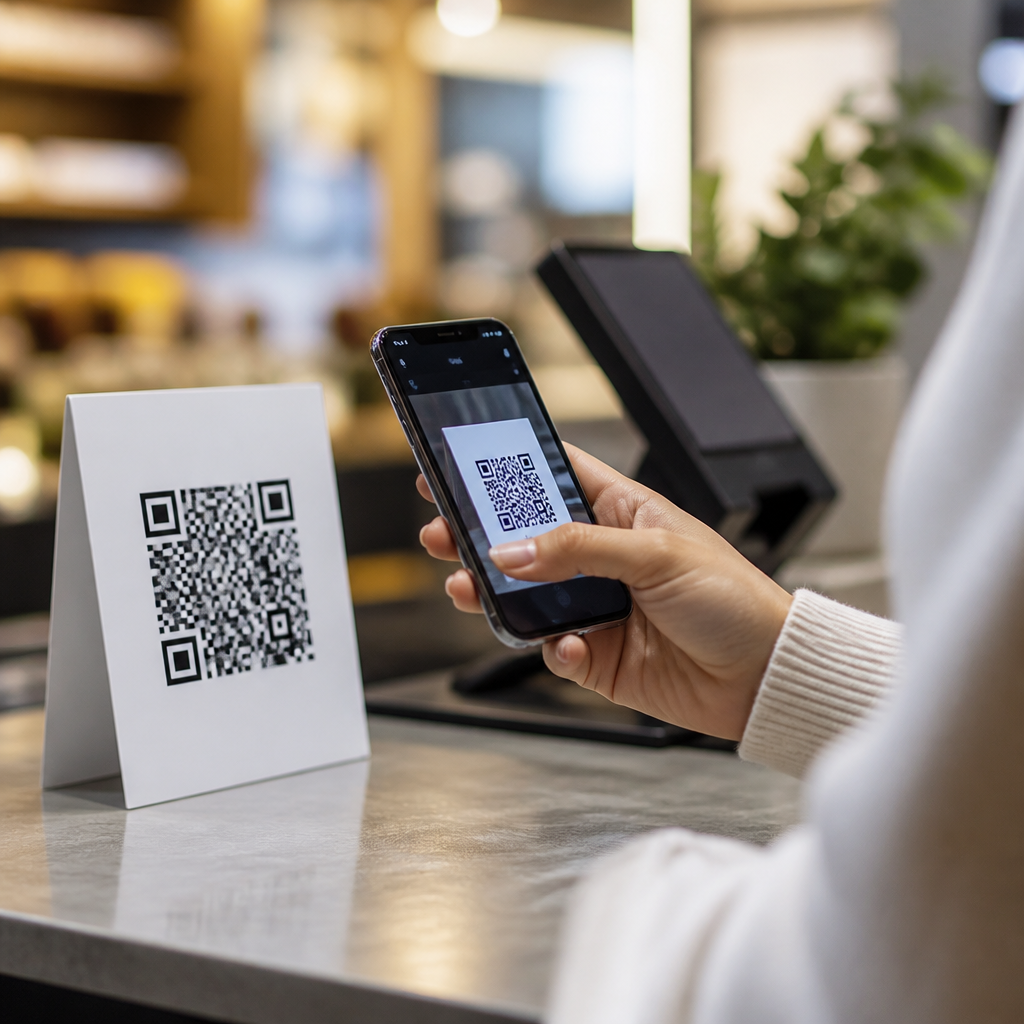
Usage patterns vary sharply by industry because the underlying customer need is different. In restaurants, menu access remains one of the clearest cases: customers are seated, have a smartphone in hand, and need information immediately. In retail, package based codes often perform well when tied to product education, authenticity verification, recipes, care instructions, or loyalty enrollment. In events, the value is speed and accuracy, since codes can simplify ticketing, badge check in, session registration, and lead capture. Healthcare and public services often see strong engagement when QR codes replace clipboards, direct patients to forms, or surface medication and appointment information in multiple languages.
The common pattern is relevance at the moment of need. A QR code on a cereal box offering sweepstakes entry may draw curiosity, but a code on a medication leaflet linking to dosage guidance addresses immediate intent and typically earns deeper engagement. B2B environments are similar. Trade show exhibitors often use booth signage codes to deliver spec sheets, book demos, or capture qualified leads. Real estate agents use codes on yard signs for property tours and mortgage calculators. Logistics teams use them for inventory lookup and chain of custody records. The strongest QR code engagement statistics usually come from workflows where speed, convenience, and certainty matter more than novelty.
Core Metrics That Define QR Code Engagement
Teams often ask what a good QR scan rate is, but there is no universal benchmark without channel context. A direct mail piece with a highly targeted audience can outperform a retail shelf display by a wide margin, even if total scans are lower. To evaluate performance correctly, track the full sequence from view to outcome. The most practical framework includes exposure, scan rate, unique scan rate, landing page engagement, conversion rate, repeat scan behavior, and downstream revenue or task completion. Dynamic QR code platforms such as Bitly, QR Code Generator PRO, Beaconstac, Uniqode, and Flowcode make these metrics easier to capture and segment.
| Metric | What it Measures | Why it Matters |
|---|---|---|
| Total scans | All scan events, including repeats | Shows gross activity and campaign reach |
| Unique scans | Distinct users or devices | Separates audience size from repeat behavior |
| Scan to visit completion | Successful page loads after scan | Reveals technical friction and connection issues |
| Conversion rate | Desired actions after landing | Connects QR activity to business outcomes |
| Time, location, device | Context of each scan | Improves placement, timing, and creative decisions |
In real analysis, these metrics often expose hidden problems. A campaign may show high scans but low visit completion because the destination redirects too many times on mobile data. Another may show modest scan volume but excellent conversion because the code appears on post purchase packaging, where user intent is higher. The lesson is simple: scan counts are only the top of the funnel. Useful QR code usage statistics connect the code to session quality, task success, and measurable commercial value.
What Drives Higher Scan and Conversion Rates
The biggest performance drivers are clarity, incentive, placement, and landing page quality. People scan when the benefit is obvious before they open the camera. “Scan for assembly video” outperforms “Scan here” because it states the reward. Size and distance also matter. A code on a storefront window needs to be larger than one on a product label, and quiet zones around the symbol must remain clear for reliable recognition. ISO and GS1 guidance on symbol quality, contrast, error correction, and print testing is not optional if a brand expects consistent scanning across packaging, signage, and industrial workflows.
Destination experience matters just as much. Mobile landing pages should load fast, match the promise near the code, and avoid unnecessary fields. If the page requests account creation before delivering value, abandonment climbs. I have repeatedly seen better results when brands offer a lightweight first step such as menu viewing, product details, or coupon reveal, then ask for signup after interest is confirmed. Trust cues help too. Users are more willing to scan when the brand is known, the URL is branded, and the context feels secure. Fraud and phishing concerns are real, especially with stickers placed over legitimate codes, so visible authenticity cues improve engagement.
Demographics, Devices, and Behavioral Patterns
QR code engagement statistics often show stronger usage among younger smartphone heavy audiences, but age alone is a poor predictor now that scanning is built into default camera apps. What matters more is digital confidence, task relevance, and environmental context. Urban commuters may scan transit ads during waiting periods. Parents may scan packaging for nutrition or setup instructions at home. Event attendees often scan in bursts around registration, session changes, and exhibitor interactions. Device differences still affect results: operating system handling, browser speed, and app deep linking can all influence whether a scan becomes a successful visit or conversion.
Behavioral timing is especially useful for optimization. Restaurant scans peak around meal windows; retail packaging scans often rise in evenings after purchase; business event scans cluster during breaks. Geographic data can reveal whether in store materials outperform outdoor signage or whether one region responds better to incentive based offers. Returning scans deserve attention too. Repeats may signal loyalty and useful revisits, or they may indicate a code that points to changing information such as rotating menus, service updates, or weekly deals. Interpreting repeat behavior accurately helps teams distinguish habitual value from unresolved user needs.
Limitations, Measurement Challenges, and the Road Ahead
No QR code dataset is perfect, and responsible reporting must acknowledge blind spots. Static codes offer little flexibility and limited native analytics. Privacy settings, cookie restrictions, and app handoffs can break attribution between scan and final conversion. Offline exposure is also hard to quantify precisely unless the audience size is known, which makes scan through rate estimates less reliable for public posters or out of home media. There is also survivorship bias in vendor case studies: high performing campaigns are published more often than weak ones. For that reason, strong QR code usage statistics should be paired with controlled testing and clear definitions.
Even with those caveats, the direction is clear. QR codes are now durable infrastructure for linking physical experiences to digital outcomes. Growth is expanding beyond marketing into payments, identity, packaging, connected products, and GS1 powered item level experiences. The practical takeaway is to treat every code as a measurable user journey, not a graphic element. Define the intent, test the placement, optimize the destination, and judge success by completed actions rather than scans alone. If you manage campaigns, packaging, retail operations, or customer experience, start building a central QR reporting framework now and use it to guide every future deployment.
Frequently Asked Questions
What do QR code engagement statistics actually measure?
QR code engagement statistics measure what happens after a person encounters and scans a code. At the most basic level, this includes total scans, unique scans, repeat scans, scan location, device type, operating system, and time of day. More advanced reporting can also track what users do after the scan, such as visiting a landing page, downloading an app, completing a purchase, submitting a form, saving contact details, viewing a menu, or redeeming an offer. In other words, engagement is not just about whether a code was scanned, but whether that scan led to a meaningful digital action.
These statistics are especially valuable because they connect offline exposure to online behavior. A poster in a store, a product package, a direct mail piece, or a table tent in a restaurant can all drive measurable interactions that would otherwise be difficult to attribute. When businesses analyze QR code engagement, they can see which placements, campaigns, messages, and calls to action produce the strongest response. This makes QR codes a practical tool for performance measurement, not just a convenience feature.
Why have QR codes become more mainstream in recent years?
QR codes became mainstream because the technology finally aligned with everyday user behavior. Most smartphones now have built-in camera scanning, which removed the friction of downloading a separate app. At the same time, consumers became much more comfortable using their phones to access information instantly, make payments, place orders, and interact with brands in physical environments. That combination turned QR codes from a niche utility into a familiar, low-friction gateway to digital content.
Another major factor was widespread adoption across industries. Restaurants used QR codes for menus and ordering, retailers used them for product information and promotions, healthcare organizations used them for forms and patient access, and logistics teams used them for tracking and operational workflows. As people repeatedly encountered codes in useful contexts, scanning became normalized. Engagement statistics reflect this shift clearly: more scans, broader demographic adoption, and stronger conversion rates in environments where the code delivers immediate value.
Which industries tend to see the strongest QR code engagement?
Industries that perform best with QR codes are usually the ones where speed, convenience, and immediate action matter most. Retail is a strong example because shoppers can scan for product details, reviews, discounts, loyalty rewards, or online checkout options while already in a buying mindset. Restaurants also see high engagement because QR codes simplify menu access, ordering, payment, and promotional offers. In both sectors, the user benefit is obvious and the action happens in real time.
Beyond retail and hospitality, healthcare, events, real estate, education, and logistics also generate meaningful QR code engagement. Healthcare providers can use codes for patient forms, check-in instructions, prescription information, and appointment resources. Event organizers use them for tickets, schedules, maps, and sponsor interactions. Real estate agents use them on signs and brochures to connect prospects with listings, videos, and contact forms. Logistics teams rely on QR codes for tracking and process accuracy. Engagement tends to be strongest wherever the scan reduces effort, speeds up access, or solves a problem in the moment.
What factors have the biggest impact on QR code scan rates and post-scan engagement?
Several factors strongly influence whether people scan a QR code and what they do afterward. Placement is one of the biggest. A code needs to be easy to see, easy to reach, and presented in a context where the person has time and motivation to act. A clear call to action also matters. People are far more likely to scan when they know exactly what they will get, such as “View the menu,” “Claim 15% off,” “Track your package,” or “Watch the product demo.” Without that clarity, many users simply ignore the code.
The destination experience matters just as much as the code itself. If the landing page loads slowly, is not mobile-friendly, or asks for too much information too soon, engagement drops quickly. Strong performance usually comes from fast-loading pages, minimal friction, and content that matches the promise made beside the code. Design factors also play a role, including size, contrast, lighting, print quality, and whether the code is positioned where a smartphone can easily capture it. Businesses that test these variables often discover that small execution improvements can lead to significantly better scan rates and conversions.
How should businesses use QR code engagement statistics to improve marketing performance?
Businesses should treat QR code engagement statistics as a practical optimization tool. Start by tracking core metrics such as total scans, unique scans, repeat scans, conversion rate, and geographic or location-based performance. Then compare those results across placements, audiences, time periods, and campaigns. This makes it easier to identify which QR codes are driving interest and which ones are underperforming. For example, a package insert might generate more conversions than a window display, or a limited-time offer might outperform a general brand message.
The most effective approach is to use the data to refine both the physical and digital experience. If scan volume is low, the issue may be visibility, placement, or the call to action. If scans are high but conversions are weak, the problem may be the landing page, offer quality, or user flow after the scan. Businesses can run A/B tests on messaging, creative, destination pages, and incentive structures to improve results over time. When interpreted correctly, QR code engagement statistics do more than report activity. They help organizations understand customer intent, reduce friction, and build stronger connections between real-world touchpoints and measurable digital outcomes.