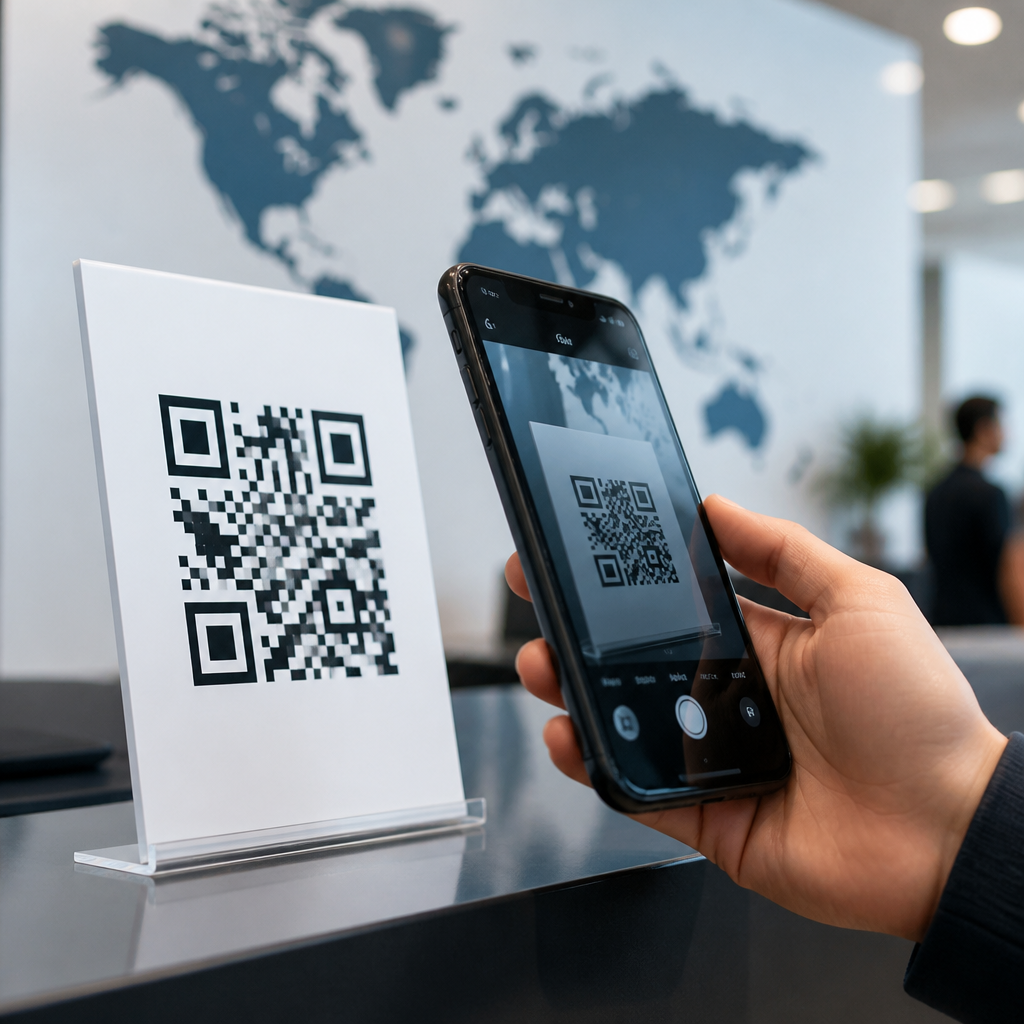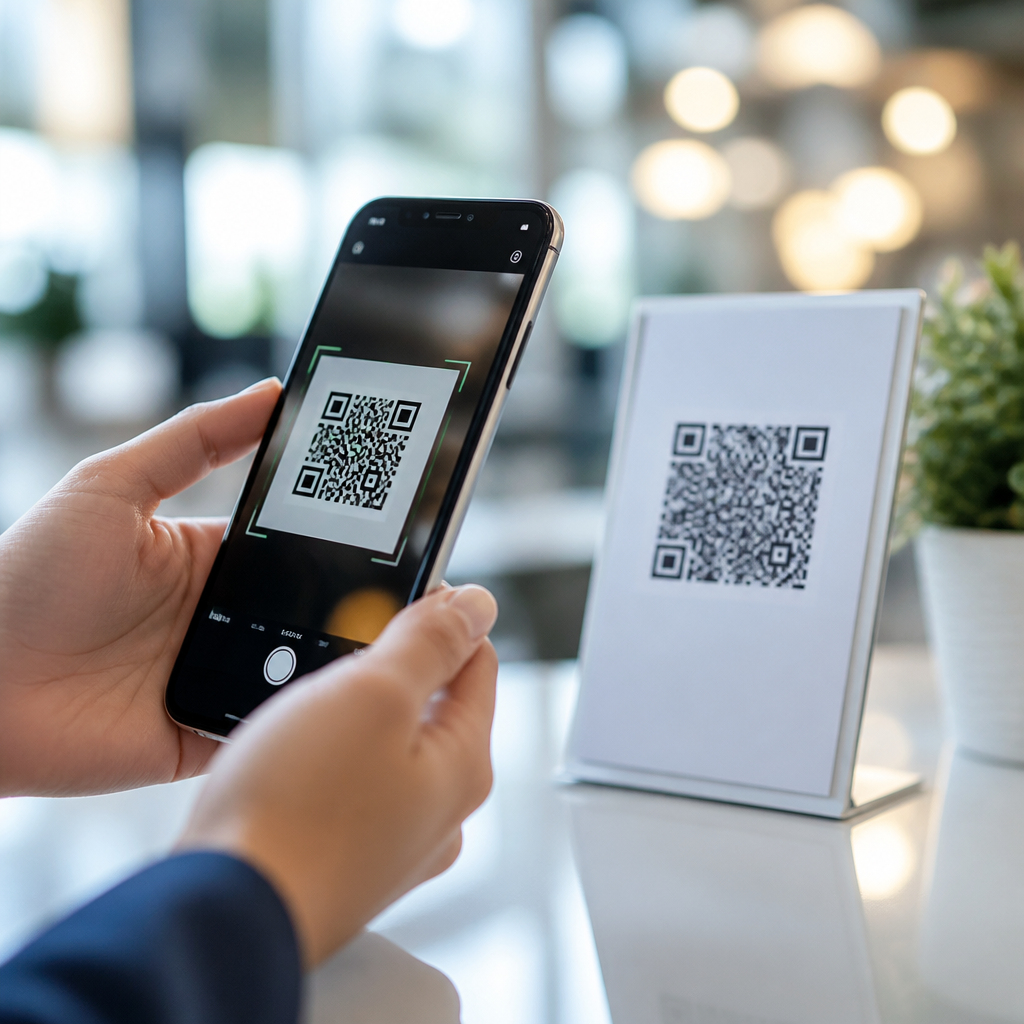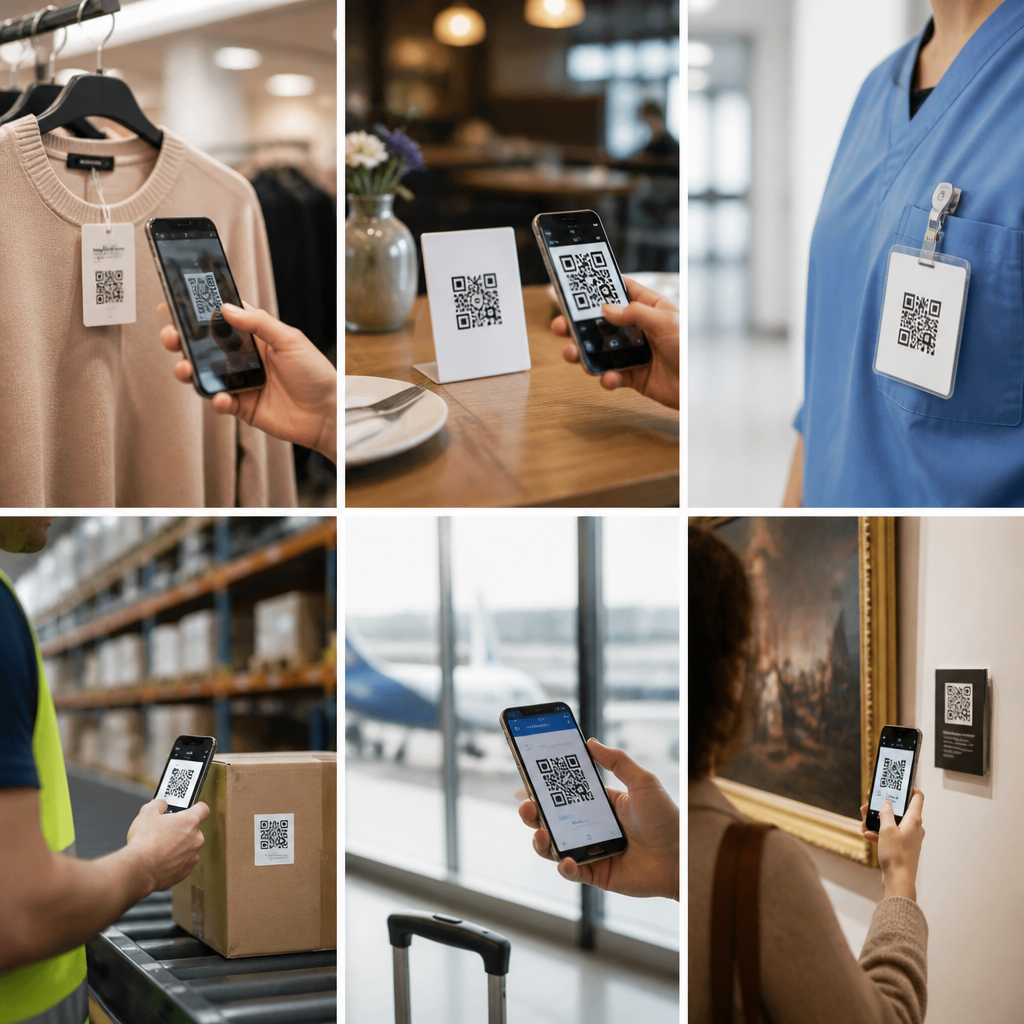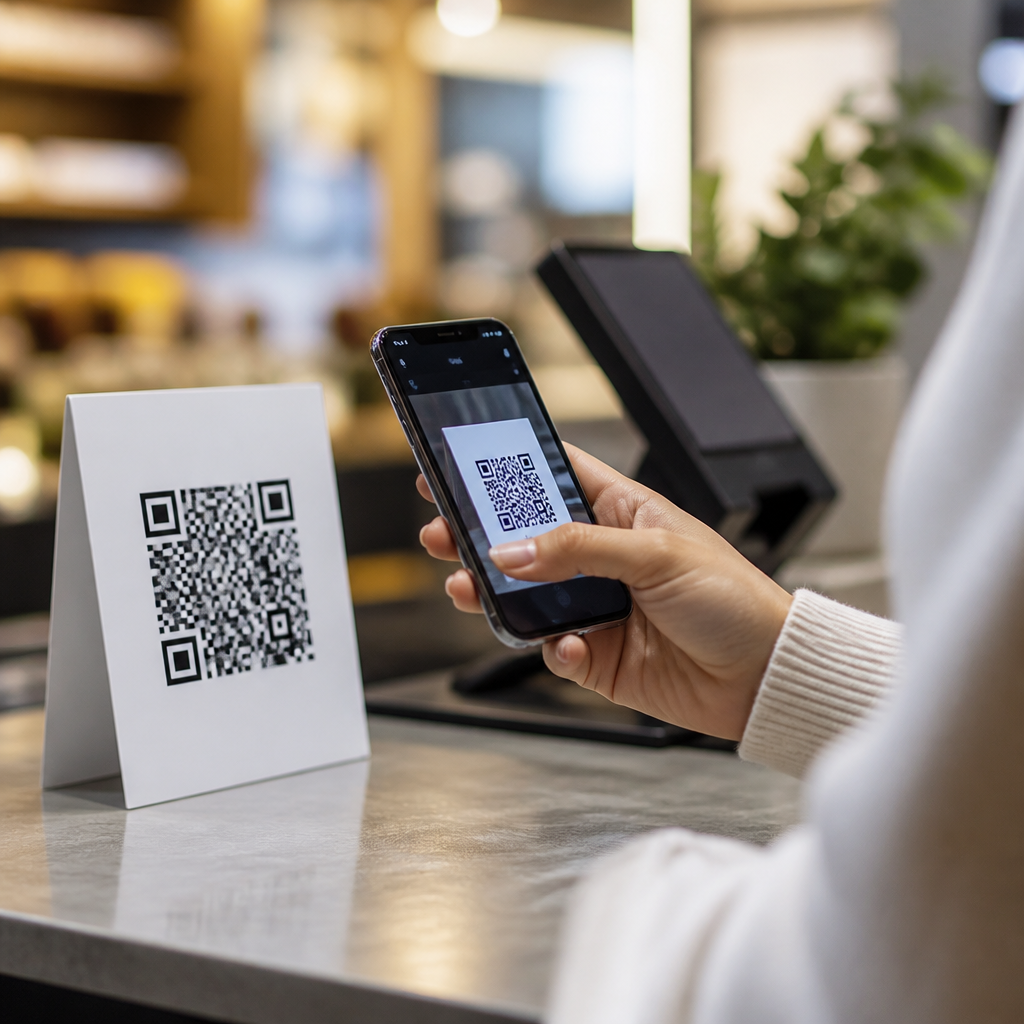

QR code marketing statistics now matter to almost every brand because the square barcode has moved from a niche utility into a mainstream bridge between offline attention and digital action. A QR code, or Quick Response code, stores data that a smartphone camera can read instantly, sending a user to a website, app, video, payment screen, coupon, form, or product page without manual typing. For marketers, that simple scan compresses the path from awareness to conversion. I have used QR campaigns in retail stores, event booths, restaurant menus, packaging inserts, and direct mail pieces, and the pattern is consistent: when the code is relevant, visible, and tied to a clear benefit, response rates rise faster than with vanity URLs alone.
Understanding QR code usage statistics helps marketers answer practical questions. Are people actually scanning? Which industries see the strongest adoption? What devices and contexts drive usage? How do dynamic QR codes, trackable links, and first-party analytics turn a printed square into a measurable media channel? These questions matter because QR codes sit at the intersection of mobile behavior, privacy-driven measurement changes, and omnichannel attribution. As cookie-based tracking becomes less reliable, marketers need channels that connect physical placements to digital analytics using UTMs, redirect rules, CRM integrations, and conversion events. QR codes do that efficiently.
The most important point is that QR performance is no longer speculative. Smartphone penetration is high, native camera scanning is standard on iOS and Android, and consumer familiarity accelerated during the pandemic through menus, payments, tickets, and public information. That behavioral shift created durable habits. Today, QR code marketing statistics show not just awareness but repeated use across age groups, sectors, and customer journeys. The numbers also reveal limits: poor design, weak calls to action, broken links, and generic landing pages still suppress results. The marketers who win with QR codes treat them as campaign assets, not decorative add-ons.
QR code adoption is broad, and mainstream behavior is the headline statistic
The core QR code usage statistic every marketer should know is simple: scanning behavior is now normal. Multiple industry studies over the last several years have shown steady increases in both the number of scans and the share of consumers who have used QR codes at least once. Data from eMarketer and Statista has consistently pointed to tens of millions of smartphone users in the United States engaging with QR codes annually, while Juniper Research has projected billions of QR code coupon redemptions and mobile interactions globally. Those figures matter because they confirm that QR usage is not confined to early adopters or one-off pandemic behavior.
In campaigns I have audited, scan rates vary widely by channel, but the baseline assumption has changed. Five years ago, teams asked whether customers knew how to scan. Now they ask what incentive will make them scan this code instead of ignoring it. That is a healthier strategic question. Retail signage, product packaging, out-of-home posters, brochures, receipts, and event badges all perform better when the benefit is explicit: “scan to compare models,” “scan for setup video,” or “scan for 15% off today.” Familiarity drives willingness, but value drives action.
Another adoption indicator is operating-system support. Apple added native QR recognition to the Camera app years ago, and Android support is now standard across major devices. This reduced friction dramatically. When scanning requires no third-party app, usage rises because the cognitive and technical barriers disappear. Marketers should treat native support as an enabling statistic even though it is not a campaign metric. It explains why QR codes now convert better in the field than many legacy benchmarks suggest.
Industry-specific QR code usage statistics show where scans happen most often
QR code usage statistics are strongest when segmented by use case. Restaurants became a defining example because menu access trained millions of consumers to scan without hesitation. Hospitality followed with check-in information, digital room guides, and feedback forms. Retail adopted QR for shelf-level product details, reviews, loyalty enrollment, and buy-online-pickup-in-store flows. Consumer packaged goods brands increasingly place codes on packaging to deliver recipes, ingredient sourcing, warranty registration, and reorder links. Healthcare uses QR for patient intake, appointment check-in, prescription information, and device instructions. Events rely on them for ticketing, networking, lead capture, and session downloads.
These sector patterns reveal a practical truth: QR codes perform best where they remove friction from a task the user already wants to complete. A restaurant menu QR code works because the diner needs the menu. A product-box QR code works because the buyer needs setup help or warranty information. A trade-show badge QR code works because exhibitors need fast lead capture. By contrast, a QR code that leads to a generic homepage on a roadside billboard usually underperforms because it asks for effort without offering enough immediate utility.
| Industry | Common QR Use Case | Why It Performs |
|---|---|---|
| Restaurants | Menus, ordering, reviews | High intent and immediate need at the table |
| Retail | Product details, coupons, loyalty | Bridges physical browsing to digital research |
| CPG | Packaging education, recipes, reorders | Extends engagement after purchase |
| Events | Tickets, lead capture, downloads | Speeds access and improves attribution |
| Healthcare | Check-in, forms, instructions | Reduces paperwork and wait time |
Conversion and measurement statistics matter more than raw scans
A large scan count is useful, but marketers should focus on QR code statistics tied to outcomes: unique scans, repeat scans, landing-page engagement, form completion, purchase rate, assisted conversions, and revenue per scan. Dynamic QR codes are essential because they route through a managed short URL, allowing edits after print and providing analytics such as timestamp, device type, approximate location, and total versus unique scans. Platforms like Bitly, QR Code Generator, Beaconstac, Flowcode, and Uniqode support this approach, while Google Analytics 4 can track downstream events when UTMs are configured correctly.
In my experience, the most revealing statistic is scan-to-session quality, not scan volume. If 1,000 people scan a code and 800 bounce, the asset or destination is weak. If 250 people scan and 120 convert to a product view, coupon claim, or lead form, the QR placement is doing real work. This is why campaign design matters. The landing page should match the promise on the sign or package, load quickly on mobile, and remove navigation clutter when the user has one clear job to do. A mismatch between physical context and digital destination destroys conversion efficiency.
Marketers should also separate assisted impact from last-click attribution. A shopper may scan a shelf tag, leave, then purchase later through direct traffic or a branded search. GA4 path exploration, CRM source fields, and post-purchase surveys help recover some of that influence. QR code marketing statistics become more strategic when they are analyzed as part of a broader customer journey rather than as isolated clicks.
Demographic and behavioral statistics explain who scans and why
One common misconception is that QR codes are mainly for younger audiences. Younger consumers do scan heavily, especially for payments, promotions, social follows, and app downloads, but usage is broader than that. Familiarity increased among older demographics during pandemic-era menu and health-information interactions, and repeated exposure turned one-time necessity into learned behavior. The better interpretation of QR code usage statistics is not that one age group owns the channel, but that context determines adoption. If the benefit is clear, the audience is surprisingly wide.
Behavioral intent matters as much as age. High-performing scans happen when users expect instant utility: access, savings, instructions, verification, or convenience. Packaging scans often skew toward post-purchase information seeking. In-store scans often support consideration and comparison. Event scans tend to be transactional and time-sensitive. These patterns help marketers choose calls to action. “Scan to watch setup in 60 seconds” works better on electronics packaging than “scan to learn more,” because it names a specific need and signals low time cost.
Location also influences outcomes. QR codes placed at eye level, near moments of decision, and in environments where users can safely pause outperform codes in motion-heavy settings. A transit ad may create awareness, but a QR code inside a store aisle, on a table tent, or on product packaging usually captures stronger intent. That is why placement statistics should always be analyzed alongside creative and environment.
Future-facing statistics show why QR codes remain a growth channel
Looking ahead, the strongest signal in QR code marketing statistics is continued integration with mobile commerce, first-party data collection, and connected packaging. As browsers and platforms restrict passive tracking, QR codes offer consent-friendly interaction points that users initiate themselves. A scan can trigger email signup, loyalty enrollment, zero-party preference capture, wallet pass download, or authenticated product registration. That makes QR codes unusually resilient in a privacy-first environment.
Growth is also tied to richer destination experiences. Brands now connect QR codes to augmented reality demos, localized inventory pages, how-to video libraries, and personalized offers. GS1 Digital Link is especially important for manufacturers and retailers because it can transform product barcodes into web-enabled identifiers, opening the door to better traceability, product information, and shopper engagement from a single standards-based framework. This is not theoretical. Consumer brands are already testing smarter packaging that links one printed code to multiple experiences depending on geography, language, or campaign period.
The takeaway is straightforward. QR code usage statistics show a mature channel with expanding utility, not a short-lived tactic. Marketers should track scan quality, segment results by context, and design every code around a real customer need. If you manage retail, events, packaging, hospitality, or direct mail, audit your current touchpoints and identify one high-intent moment where a QR code can remove friction. Then launch with a dynamic code, a mobile-first landing page, and clean analytics. The data will tell you quickly where to scale next.
Frequently Asked Questions
Why are QR code marketing statistics so important for modern marketers?
QR code marketing statistics matter because they show how a once-simple utility has become a measurable conversion tool across retail, events, packaging, restaurants, out-of-home advertising, direct mail, and product marketing. A QR code removes friction by letting someone move from physical attention to digital action in seconds. Instead of asking a customer to remember a URL, search for a brand, or type a long landing page address, a scan can take them directly to a product page, signup form, coupon, payment screen, app download, menu, video, or review request. That speed changes campaign performance in meaningful ways.
For marketers, the statistics around scan rates, mobile usage, campaign adoption, and consumer comfort help validate where QR codes fit in the customer journey. They are especially useful when proving that offline media can be tracked more effectively than many teams assume. A print ad, product label, in-store sign, postcard, trade show booth, or billboard can all generate measurable digital engagement when paired with a well-placed QR code. The data can reveal which channels drive the most scans, what time users engage, which devices they use, and whether those scans lead to conversions.
These statistics also help marketers make smarter budget decisions. If data shows increasing consumer familiarity with QR scanning and stronger mobile engagement across campaigns, brands can justify investing more confidently in connected packaging, direct response print, omnichannel promotions, and location-based experiences. In short, QR code marketing statistics are important because they turn what used to be a passive offline impression into an active, measurable, and optimizable performance channel.
What do QR code marketing statistics typically measure?
QR code marketing statistics usually measure a mix of adoption, engagement, behavior, and conversion outcomes. At the top level, marketers often look at how widely QR codes are being used by brands and how familiar consumers are with scanning them. That includes overall scan growth, smartphone camera compatibility, consumer awareness, and industry adoption trends. These numbers help establish whether QR codes are still emerging or already mainstream within a specific market.
At the campaign level, the most common metrics include total scans, unique scans, repeat scans, scan-through rate, device type, operating system, location, and time of day. Those details help marketers understand not just how many interactions happened, but what kind of audience responded and under what conditions. For example, a poster in a commuter hub might produce strong morning scan activity, while a restaurant table tent may drive higher evening engagement.
Beyond the scan itself, strong QR code reporting also measures what happens after the scan. That includes landing page visits, bounce rate, dwell time, form submissions, purchases, coupon redemptions, app installs, video views, email signups, and other downstream conversions. This is where QR code marketing becomes especially valuable, because the scan is only the entry point. The real goal is understanding how effectively that interaction moves someone deeper into the funnel.
Advanced marketers may also compare QR performance by creative version, placement, incentive, audience segment, or destination page. In other words, QR code statistics can measure both demand and quality. They tell you not only whether people are scanning, but whether the scan is producing business results that justify the campaign.
How can marketers use QR code statistics to improve campaign performance?
Marketers can use QR code statistics to optimize both the creative and strategic parts of a campaign. The first step is treating each QR code placement as a testable touchpoint rather than a generic shortcut. If different ads, packages, displays, mailers, or event assets each use their own trackable code, marketers can see exactly which environment drives the strongest engagement. That level of visibility makes it easier to identify what is actually working instead of relying on assumptions.
Performance data can also improve messaging. If one QR code with a clear call to action such as “Scan for 20% off” consistently outperforms a code that simply says “Learn more,” the takeaway is immediate: value and clarity matter. The same principle applies to design choices such as code size, placement, contrast, surrounding whitespace, and whether supporting copy explains what happens after the scan. Statistics help remove guesswork from these decisions.
Another major use of QR data is landing page optimization. A campaign may generate plenty of scans but still underperform if the destination page is slow, confusing, or not mobile-friendly. By comparing scans to conversion metrics, marketers can pinpoint whether the issue lies in the code placement or the post-scan experience. If scans are high but signups are low, the bottleneck is probably after the scan. If scans are low to begin with, the problem may be visibility, incentive, or audience fit.
Marketers can also use QR code statistics to improve attribution across offline and online channels. A direct mail campaign, in-store display, product insert, or event handout can be given unique QR tracking so teams can connect physical interactions to digital outcomes. Over time, these insights support smarter media planning, stronger audience targeting, and better ROI reporting. The biggest advantage is that QR data makes optimization practical in channels that were once difficult to measure precisely.
What industries benefit the most from tracking QR code marketing statistics?
Nearly every industry can benefit from tracking QR code marketing statistics, but the strongest results often appear in sectors where physical presence and digital action need to connect quickly. Retail is one of the clearest examples. Stores can place QR codes on shelves, displays, packaging, receipts, and window signage to drive product education, loyalty signups, coupons, reviews, and ecommerce purchases. Tracking scan behavior helps retailers understand which locations, promotions, and product categories create the most engagement.
Restaurants and hospitality brands also gain significant value. QR codes can streamline menus, ordering, payments, feedback collection, loyalty enrollment, and special offers. In these environments, scan data helps operators measure customer interaction in real time and adjust messaging based on response patterns. Travel, tourism, and entertainment brands use QR codes on tickets, posters, brochures, and venue signage to guide visitors toward schedules, upgrades, maps, promotions, and digital experiences.
B2B marketing benefits as well, especially at trade shows, conferences, product demos, and direct mail campaigns. A QR code can instantly connect prospects to case studies, booking forms, presentations, spec sheets, or lead capture pages. Marketers can then compare scan and conversion rates by event, audience segment, or asset type. Consumer packaged goods brands also use QR codes on product labels and packaging to deliver recipes, sustainability information, warranty registration, product authentication, and cross-sell opportunities.
The broader point is that any industry with a physical touchpoint can use QR statistics to improve the link between attention and action. Whether the goal is awareness, lead generation, purchase, education, service, or retention, QR codes give marketers a practical way to make offline experiences more interactive and more measurable.
What are the best practices for getting better results from QR code marketing campaigns?
The most effective QR code campaigns combine strong usability, clear intent, and reliable tracking. First, marketers should make the reason to scan obvious. A QR code by itself is not a strategy. People are more likely to engage when the surrounding message explains the benefit, such as accessing a discount, watching a demo, claiming an offer, downloading an app, joining a loyalty program, or learning something useful. Clear calls to action consistently outperform vague instructions.
Design and placement are just as important. The code should be large enough to scan comfortably, placed where a smartphone can capture it without awkward angles, and printed with enough contrast and whitespace to remain readable. Marketers should think about the scanning environment: distance, lighting, movement, and device type all affect performance. A code on a fast-moving transit ad needs different design considerations than one on product packaging or a countertop display.
It is also essential to send users to a mobile-optimized destination. Since most QR scans happen on smartphones, a landing page that loads slowly or displays poorly can ruin an otherwise strong campaign. The destination should match the promise of the call to action, load quickly, and minimize unnecessary steps. If the goal is lead generation or purchase, the process should be as short and frictionless as possible.
From a measurement standpoint, marketers should use dynamic and trackable QR codes whenever possible. That allows teams to update destinations without reprinting assets and to collect richer performance data across different placements and audience segments. Testing is another best practice. Brands should compare different offers, wording, formats, destinations, and physical contexts to understand what drives the strongest response. Finally, QR codes should be integrated into a larger marketing system rather than treated as standalone tactics. When connected to analytics, CRM workflows, retargeting, and conversion tracking, QR campaigns become far more valuable and far easier to scale.