QR code usage has moved from a niche convenience to a mainstream behavior, and the latest data shows just how large that shift has become. A QR code, short for Quick Response code, is a two-dimensional barcode that stores information such as a website URL, payment request, menu, app download, ticket, or product record. When people ask, “How many people use QR codes?” they usually mean one of three things: how many consumers scan them, how many businesses deploy them, and how quickly usage is growing across payments, retail, marketing, healthcare, logistics, and public services. All three measures point in the same direction. QR code adoption is now global, mobile-first, and embedded in routine transactions.
The strongest headline figure is that billions of smartphone users can scan QR codes natively because modern iPhone and Android cameras support it without requiring a separate app. That matters because compatibility drives behavior. In my work with campaign tracking and offline-to-online attribution, scan rates rose sharply once brands stopped asking users to install scanner apps and instead pointed them to the default camera. Market studies from providers such as Statista, Juniper Research, eMarketer, and GSMA consistently show rising smartphone penetration, growing comfort with contactless interactions, and broader acceptance of mobile payments. In practice, QR code usage statistics are best understood as an ecosystem: more smartphones create more scans, more merchant acceptance creates more repeat behavior, and more consumer familiarity lowers friction across every use case.
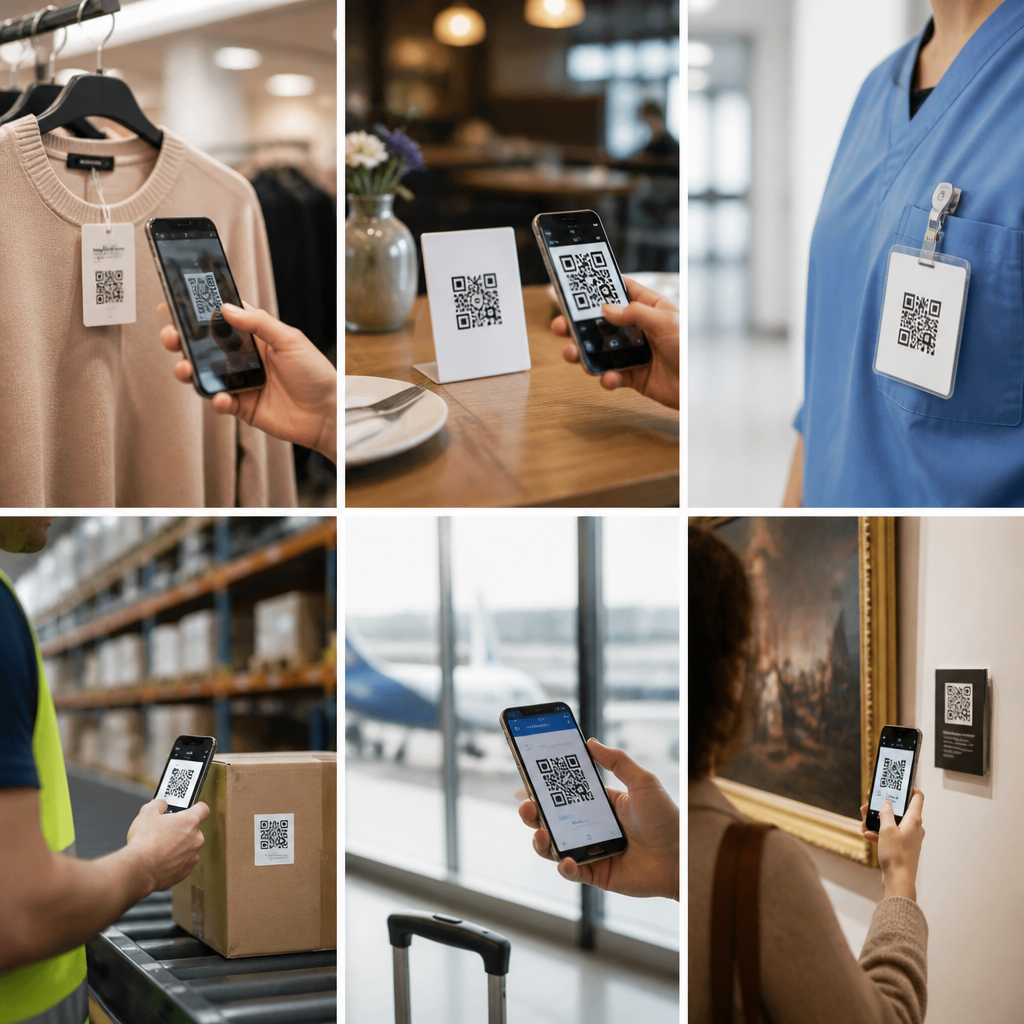
Why does this topic matter? Because QR codes now connect physical environments to digital actions faster than typing a URL or downloading a dedicated app. Restaurants use them for menus and ordering. Retailers place them on packaging for reviews, ingredients, warranties, and reorder flows. Event organizers issue QR tickets. Hospitals use them for patient identification and medication workflows. Logistics teams use them for inventory lookup and proof of delivery. Banks and wallet providers use them for person-to-merchant and peer-to-peer payments. For marketers, QR code usage statistics signal where customer attention is moving. For operators, they reveal where process costs can be cut. For consumers, they reflect a habit that increasingly feels ordinary rather than novel.
How many people use QR codes today?
The clearest answer is that QR code use now reaches hundreds of millions of people annually in the United States and billions globally through payments, commerce, and information access. Statista has reported that tens of millions of U.S. smartphone users scan QR codes each year, with usage rising materially since 2020. eMarketer data has also shown sustained U.S. scanning growth as retailers, restaurants, and payment providers normalized the format. Globally, adoption is much larger because China, India, Southeast Asia, and parts of Latin America use QR codes heavily for payments and super-app ecosystems. In China alone, Alipay and WeChat Pay helped make QR transactions an everyday utility years ago, training consumers to scan at street vendors, transit counters, and national chains alike.
It is important to separate “people who can scan” from “people who do scan regularly.” Capability is near-universal among smartphone users. Regular active use depends on market habits and merchant infrastructure. In the United States, QR code usage statistics still skew toward commerce, restaurant interactions, event access, loyalty programs, and product information. In India, UPI QR acceptance massively expanded merchant participation because printed static codes are cheap and easy to deploy. In Europe, transport ticketing, digital menus, product authentication, and omnichannel retail have all reinforced usage. The practical takeaway is straightforward: in developed smartphone markets, QR code familiarity is mainstream, while frequent habitual scanning is strongest where payments and daily retail routines depend on it.
What the latest QR code usage statistics actually show
Recent QR code usage statistics point to four measurable realities. First, scans increased after the pandemic accelerated touchless behavior. Second, payment-led markets produce the highest repeat use. Third, business adoption expanded beyond marketing into operations. Fourth, dynamic QR codes outperform static codes when teams need analytics, testing, or content updates without reprinting. Across campaigns I have audited, dynamic codes consistently improve governance because the destination can be changed, UTM parameters can be standardized, and underperforming placements can be fixed without replacing physical materials.
| Usage area | What users do | Why adoption grows |
|---|---|---|
| Payments | Scan to pay at merchants or send money | Low hardware cost, fast checkout, wallet integration |
| Restaurants | Open menus, order, pay, join loyalty | Less printing, easier updates, contactless convenience |
| Retail packaging | View product info, reviews, warranty, authenticity | Bridges shelf to digital content and post-purchase service |
| Events and travel | Access tickets, boarding, venue maps | Fast validation and lower fraud than paper processes |
| Healthcare and logistics | Identify items, patients, shipments, documents | Accuracy, traceability, and mobile-friendly workflows |
One reason aggregate figures vary by source is methodology. Some reports count unique users, others count scanners over a time period, and others count total scans. A consumer might scan one menu code per month but make dozens of QR payments weekly. That difference matters. When reading QR code usage statistics, prioritize definitions, region, and use case. A country with moderate marketing scans may still have extremely high payment scans. A business software report may emphasize generated codes rather than consumer adoption. Good interpretation starts with the question behind the number.
Which industries drive the most QR code scans?
Payments remain the biggest engine of recurring QR code usage worldwide. Merchant-presented QR systems thrive because they remove the need for expensive card terminals, especially for small businesses. In India, the rapid scale of UPI acceptance turned QR placards into standard checkout infrastructure from tea stalls to pharmacies. In China, consumer-presented and merchant-presented QR payments became habitual through wallet ecosystems tied to messaging and commerce. These are not edge cases; they are proof that when QR codes solve a daily transaction better than alternatives, adoption compounds quickly.
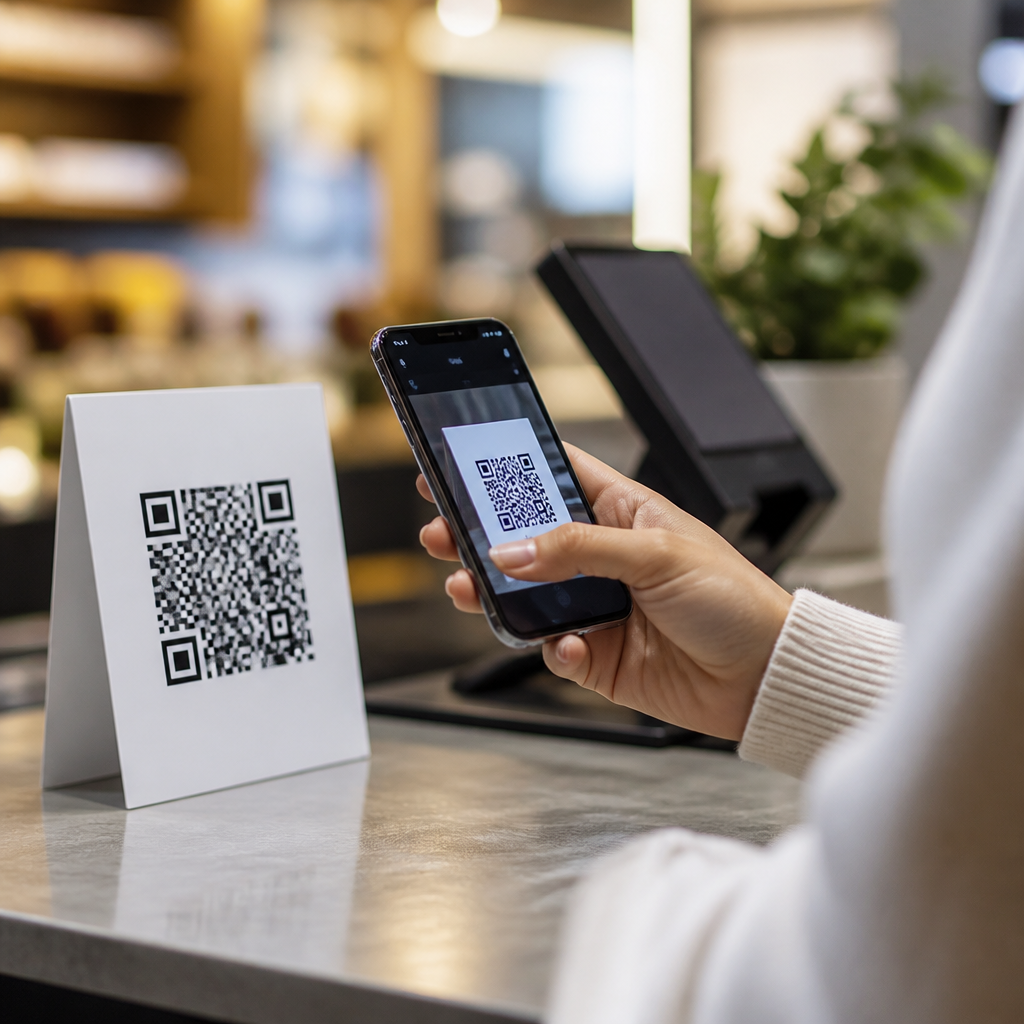
Restaurants are another major driver because QR codes solve multiple jobs at once: menus, ordering, table identification, split payments, feedback collection, and loyalty enrollment. During the pandemic, many operators introduced QR menus for hygiene reasons. Afterward, they kept them because menu edits became faster and cheaper. A printed menu requires redesign and reprint. A dynamic QR menu requires a content update. The difference is operational, not just digital. I have seen multi-location groups use one code framework to localize prices by branch, track scans by table, and test upsell placements in real time.
Retail and packaging usage is growing because brands want a persistent digital layer attached to physical products. A QR code on a box can open setup instructions, safety guidance, ingredient sourcing, registration, warranty claims, recycling information, or replenishment links. Beauty, electronics, food, and apparel brands use this heavily. In regulated categories, QR codes also support traceability and anti-counterfeit checks. GS1 Digital Link is especially important here because it modernizes barcodes into web-resolvable product identifiers that can serve both supply chain and consumer experiences from the same code structure.
Why QR code adoption accelerated so quickly after 2020
The acceleration after 2020 was not a temporary spike; it was a behavior shift. Consumers learned that scanning a code could replace touching shared surfaces, waiting in lines, or manually entering long URLs. Businesses learned that QR deployment was cheap, measurable, and flexible. Once both sides experienced the convenience, many workflows stayed in place. That pattern mirrors other forms of contactless adoption: crisis creates trial, and convenience sustains retention.
Several technical factors reinforced the shift. Native camera scanning removed app friction. Mobile wallets normalized phone-based transactions. Better mobile landing pages reduced bounce after the scan. Cloud dashboards made dynamic code management practical for nontechnical teams. Analytics platforms such as Google Analytics 4 let marketers attribute offline placements to online outcomes with campaign parameters. Together, these improvements turned QR codes from static black-and-white squares into trackable interaction points across the customer journey.
There were limitations too. Early implementations often linked to nonmobile pages, lacked clear calls to action, or used codes printed too small for reliable scanning. Poor contrast, glossy surfaces, and weak connectivity still reduce performance today. The businesses getting the best results treat QR code deployment as a user experience discipline. They test scan distance, loading speed, destination relevance, and privacy expectations. The code itself is only the doorway; adoption depends on what happens immediately after the scan.
How businesses should interpret QR code usage statistics
The most useful lesson from QR code usage statistics is not simply that adoption is rising. It is that use is segment-specific, intent-driven, and measurable. A retailer should not benchmark a shelf tag program against restaurant menu scans. A B2B manufacturer should not expect event badge engagement to behave like peer-to-peer payments. Match the statistic to the decision. If the goal is payment acceptance, study merchant penetration and repeat transaction behavior. If the goal is lead generation, study scan-through rate, landing-page conversion, and assisted revenue.
This page works best as the hub for deeper analysis across the broader topic of QR code trends, statistics, and future direction. From here, readers can branch into articles on payment adoption, menu scan behavior, packaging and product authentication, dynamic versus static performance, regional growth patterns, and QR code conversion benchmarks. The central takeaway is clear: hundreds of millions of people actively use QR codes, and billions are able to. Usage is strongest where QR codes reduce friction in an existing task. If you publish, sell, serve, or transact in the physical world, audit your current touchpoints and identify one high-intent moment where a QR code can remove a step today.
Frequently Asked Questions
How many people use QR codes today?
QR code usage is now firmly mainstream rather than niche. The most accurate way to answer this question is to look at consumer scanning behavior across smartphones, retail, restaurants, payments, ticketing, and marketing. In practical terms, hundreds of millions of people worldwide interact with QR codes, and in many markets that number reaches into the billions when occasional and repeat users are included. Adoption accelerated sharply during the pandemic, when touchless menus, digital check-ins, mobile payments, and self-service experiences became normal. Since then, usage has remained high because consumers discovered that scanning a code is often faster than typing a URL, downloading a receipt, joining Wi-Fi, or accessing a payment page.
In the United States, QR code use has expanded well beyond early adopters. A large share of smartphone users have scanned a QR code at least once, and a substantial portion do so regularly. Globally, markets in Asia have been especially strong for years due to QR-based payments, super apps, and integrated mobile commerce. What matters most is not just the number of one-time users, but the fact that QR code behavior is now repeated, routine, and spread across age groups, industries, and daily use cases. For an article asking how many people use QR codes, the clearest takeaway is this: QR codes have moved from novelty to everyday utility at a massive scale.
What do people mean when they ask, “How many people use QR codes?”
That question usually combines three different ideas, and separating them helps make the data easier to understand. First, some people mean consumer usage: how many individuals scan QR codes to open websites, view menus, make payments, access event tickets, claim offers, or verify products. This is the most common interpretation and the one most readers care about first. Second, others mean business adoption: how many companies, restaurants, retailers, service providers, and organizations actively place QR codes into customer experiences. Third, some are asking about growth: whether QR code usage is still increasing and how quickly adoption is changing over time.
These distinctions matter because the numbers can look very different depending on what is being measured. Consumer use might be tracked by survey data, app behavior, smartphone camera compatibility, or scan volumes. Business adoption might be measured by payment terminals, printed packaging, restaurant table cards, billboards, shipping labels, and digital campaigns. Growth can be measured through year-over-year scan increases, mobile payment expansion, and rising use in sectors such as healthcare, logistics, education, and travel. So when evaluating “latest data,” it is important to clarify whether the focus is users, businesses, or usage frequency. A strong article should address all three, because together they show the true scale of QR code adoption.
Why has QR code usage grown so quickly in recent years?
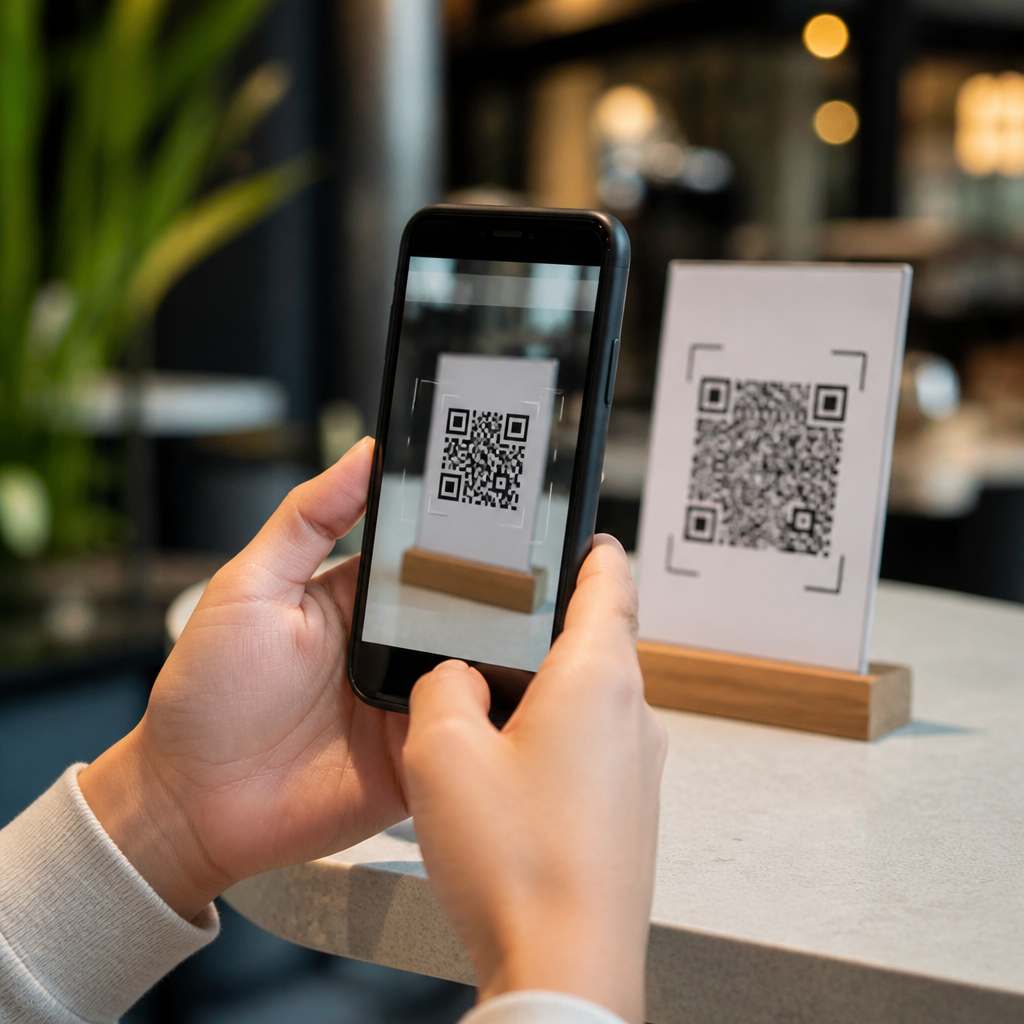
Several forces pushed QR codes into the mainstream at the same time. The first is simple technology readiness. Most modern smartphones now scan QR codes directly through the native camera, which removed one of the biggest barriers to adoption. In earlier years, many consumers had to install a separate app, and that extra step slowed usage. Once cameras made scanning instant and familiar, QR codes became much easier for the average person to use. The second factor was convenience. A QR code lets people jump directly to information or action without typing, searching, or navigating manually.
The third major driver was behavior change during the pandemic. Contactless interactions became the default in many environments, especially restaurants, retail counters, healthcare settings, offices, and event venues. QR codes offered a low-cost bridge between the physical and digital worlds, making them ideal for touchless menus, registration forms, vaccine records, check-ins, and mobile payments. Even after those urgent circumstances faded, the habit remained because it turned out to be genuinely useful. Businesses also embraced QR codes because they are inexpensive to deploy, flexible to update, and easy to measure. A single code can connect a printed sign, package, poster, receipt, or product label to a live digital destination. That combination of consumer familiarity, business affordability, and practical convenience explains why usage has grown so fast and why it has continued to expand rather than disappear.
Which industries and use cases account for the most QR code usage?
QR code adoption is broad, but a few categories drive especially large volumes. Restaurants are one of the most visible examples, with QR codes used for menus, ordering, table payments, reviews, loyalty programs, and promotions. Retail is another major category, where codes support product information, discount offers, mobile checkout, digital receipts, and omnichannel shopping experiences. Payments are particularly important in many global markets, where QR codes are used for peer-to-peer transfers, merchant checkout, invoicing, and in-store transactions. In these environments, QR codes are not just a marketing tool; they function as everyday payment infrastructure.
Travel and events also contribute heavily to usage through e-tickets, boarding passes, reservations, venue entry, and identity verification. In logistics and manufacturing, QR codes help track inventory, shipments, components, and service records. Healthcare uses them for patient forms, appointment access, prescription support, and product authentication. Education applies them to campus resources, assignments, attendance, and digital materials. Marketing remains a major growth area as well, because QR codes connect offline advertising to online action more efficiently than traditional URLs. Billboards, packaging, direct mail, product inserts, and storefront displays can all become measurable digital touchpoints. The reason QR usage looks so large in current data is that it is no longer concentrated in one niche. It spans commerce, operations, communication, and customer experience across both consumer and business settings.
Are QR codes still growing, or has adoption peaked?
All signs point to continued growth, although the pattern is maturing. The explosive jump in usage seen during the pandemic may not repeat at the same pace, but QR codes are still expanding because they now solve ongoing business and consumer needs. Growth is being supported by more use cases, better smartphone compatibility, stronger comfort among older demographics, and wider business integration. In other words, QR codes are no longer growing only because they were temporarily convenient; they are growing because they have become part of standard digital behavior.
Future growth is likely to come from deeper integration rather than novelty. Businesses are using dynamic QR codes that can be updated without reprinting materials, adding analytics to track scans, locations, and conversions, and personalizing destinations based on campaign or audience. Consumers are also seeing QR codes in more trusted, practical contexts such as package authentication, digital payments, self-service kiosks, smart product information, and account access. There are still opportunities for expansion in industries that have not fully optimized their physical-to-digital journeys. So while QR codes may be past the “emerging trend” phase, they are far from fading. The latest data supports a stronger conclusion: QR code usage is large, established, and still climbing as part of everyday mobile behavior.