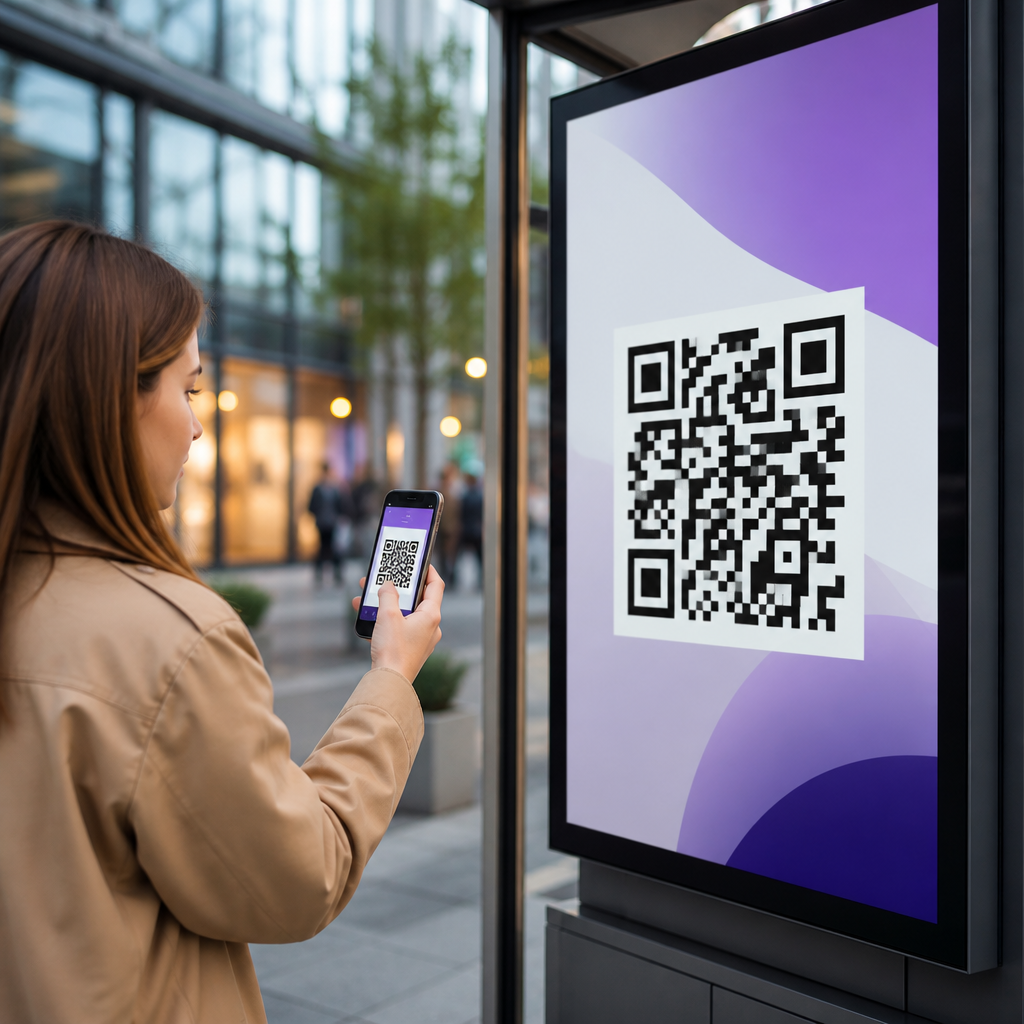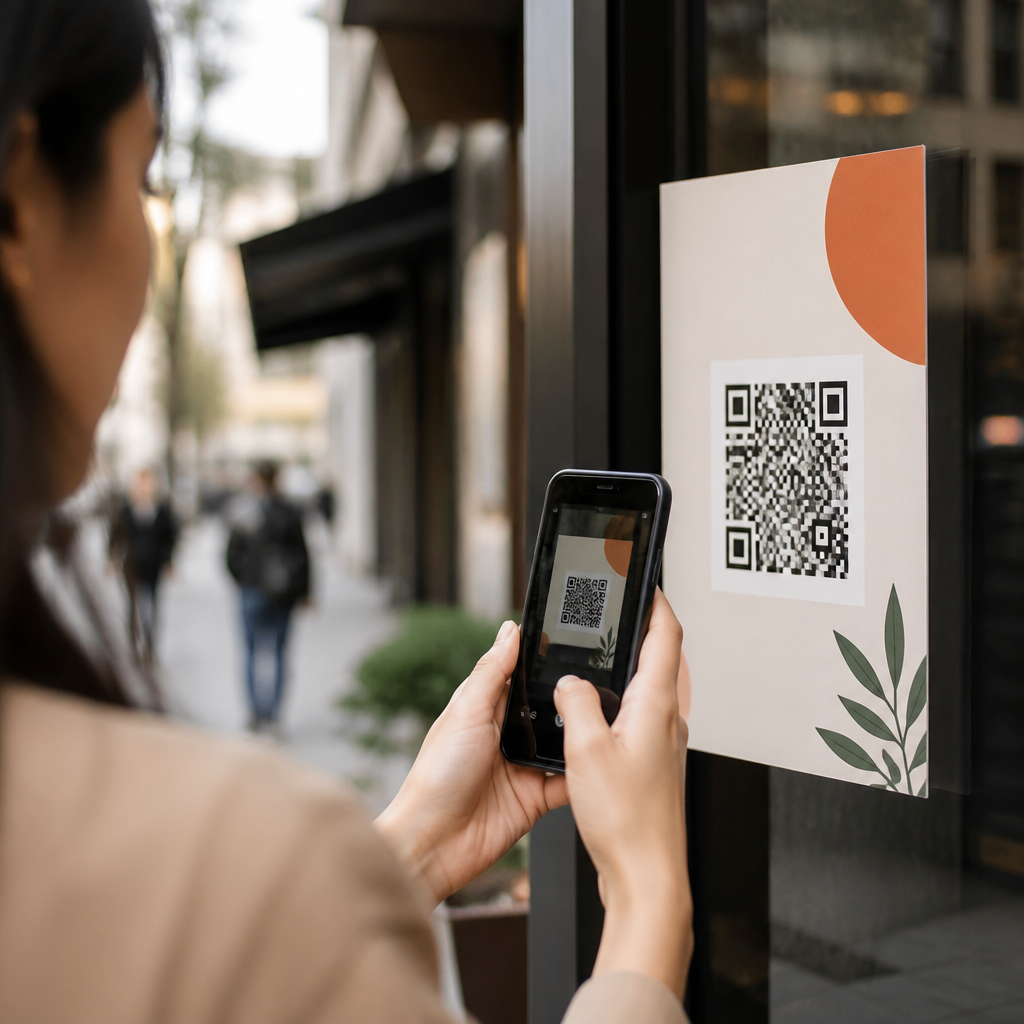

QR code analytics and tracking turn a simple scan into measurable campaign intelligence, which is why marketers who use mobile QR codes for marketing at scale rely on data, not guesswork, to improve performance. A QR code is a scannable matrix barcode that sends a user to a destination such as a landing page, app store listing, digital menu, coupon, form, or video. QR code data includes scans, unique visitors, device type, operating system, time of scan, approximate location, and downstream actions when proper tagging and analytics are in place. In practice, I have found that teams often launch beautifully designed QR campaigns but fail to define what success looks like before printing materials, which makes optimization difficult. This matters because QR placements now span packaging, direct mail, retail displays, out of home media, product inserts, events, and connected TV companion experiences. Each placement reaches people in different contexts, and those contexts affect scan intent, conversion rate, and revenue. When marketers understand QR code analytics and tracking, they can connect offline exposure to online behavior, compare channels fairly, reduce wasted spend, and improve creative, targeting, timing, and destination pages with evidence.
Effective optimization starts with definitions. Static QR codes point to a fixed destination and usually offer limited flexibility after launch. Dynamic QR codes use a short redirect URL so the destination can change later, and that redirect also enables scan measurement. Scan rate refers to how often exposed users scan, while conversion rate measures how many scanners complete the desired action, such as purchasing, registering, downloading, or redeeming. Attribution is the process of assigning credit to the QR touchpoint within a customer journey that may include email, paid search, social, and in store visits. Good campaign optimization requires all three: reliable scan tracking, clear conversion measurement, and a consistent attribution model. Without that foundation, reported performance is often inflated by duplicate scans, undercounted because of cookie loss, or misread because teams compare campaigns with different goals. The hub role of this topic is to help marketers organize those moving parts into one operating system for better decisions.
Build a Reliable QR Code Measurement Framework
The most important step in QR code analytics and tracking is establishing a measurement framework before launch. Start by documenting the campaign objective, primary audience, call to action, landing experience, and success metrics. For awareness, measure total scans, unique scans, engaged sessions, and assisted conversions. For lead generation, track form starts, completions, cost per lead, and qualified lead rate. For ecommerce, track product views, add to cart rate, checkout completion, average order value, and return on ad spend. I recommend assigning every QR code a naming convention that identifies channel, creative, placement, geography, audience, and date, because reporting breaks quickly when teams label assets inconsistently. A code named DM_Spring_Catalog_Page12_US_Women_2026-03 tells you far more than FinalQR3. This structure supports cleaner dashboards, easier troubleshooting, and faster optimization cycles across large programs.
Use dynamic QR codes with UTM parameters and a web analytics platform such as Google Analytics 4 or Adobe Analytics. The dynamic redirect records the scan event, while UTMs classify traffic source, medium, campaign, content, and term. In GA4, define conversions and build audiences for scanners so you can compare their behavior with visitors from email or paid social. Pair web analytics with a tag manager to fire events for scroll depth, video plays, button clicks, coupon opens, and purchases. If your destination is a native app, use deep linking and a mobile measurement partner such as AppsFlyer or Adjust to preserve campaign context. For customer relationship management, pass QR source data into HubSpot, Salesforce, or Marketo so sales teams can see which offline asset generated the lead. These integrations are what turn QR code data from interesting scan counts into actionable business intelligence.
Track the Metrics That Actually Improve Campaigns
Not every metric deserves equal attention. Scan volume is useful, but optimization depends on ratios and quality signals. Unique scan rate shows how many individual people responded, reducing distortion from one person scanning repeatedly. Scan to session rate indicates whether the landing page loaded correctly and whether redirects were too slow. Bounce rate can be misleading on single page experiences, so engaged sessions, average engagement time, and key event completion are better indicators of interest. When evaluating physical placements, I look closely at scan rate by estimated impressions, because a low raw scan count on a niche in store display may outperform a large transit poster once exposure is normalized. For commerce campaigns, revenue per scan and conversion rate by device type often reveal hidden friction. For example, Android users may convert less if a form validates poorly on certain browsers, while iPhone users may abandon a coupon flow if Apple Wallet is not offered.
| Metric | What it tells you | Optimization use |
|---|---|---|
| Unique scans | How many individual users responded | Compare audience response across placements |
| Scan-to-session rate | Whether scans become usable visits | Fix redirect speed or broken links |
| Conversion rate | How efficiently traffic completes the goal | Improve landing page, offer, and form flow |
| Revenue per scan | Monetary value of each response | Shift budget toward high-value placements |
Contextual metrics add another layer. Time of day can show whether office lobbies drive weekday scans while packaging produces evening conversions at home. Location clusters may reveal stronger results near stores with better merchandising. New versus returning scanners can expose whether a campaign is broadening reach or simply re-engaging existing customers. If you are using QR codes in print, compare response by size, placement on page, and surrounding copy. In one catalog program I worked on, moving the code from the bottom margin to a product callout box increased unique scan rate because the benefit was explicit at the decision point. Small design changes can create large measurement gains, but only when the right metrics are monitored consistently.
Use QR Code Data to Optimize Creative, Placement, and Landing Pages
Optimization happens when data changes execution. Creative is usually the first lever. A QR code without a reason to scan underperforms almost every time. The strongest calls to action are concrete: “Scan to see color options,” “Scan for assembly video,” or “Scan to claim 15% off today.” Scan data lets you test these promises across audiences and placements. If event badges generate many scans but few conversions, the problem may be low intent or a weak destination page. If shelf talkers get fewer scans but stronger purchase rates, they deserve more space because the shopper is closer to buying. Placement also matters physically. Codes on curved packaging, reflective surfaces, or low light areas often scan poorly. I have seen campaigns blamed on weak offers when the real issue was a glossy laminate that interfered with smartphone cameras.
Landing page optimization should be approached with the same rigor used for paid media. Match the message on the physical asset to the first screen after the scan. Reduce load time, keep forms short, and prioritize mobile layout, thumb friendly buttons, and autofill. If the code is scanned from out of home media, assume the user is distracted and give them a fast path such as directions, saved offer, or text me this link. If the code is scanned from packaging at home, longer educational content may work because attention is higher. A/B testing tools such as Optimizely, VWO, or native experiments in your content management system can compare headlines, offers, and page structures. When paired with QR source data, these tests show which combinations of placement and landing experience drive the best outcomes, not just the most traffic.
Strengthen Attribution, Reporting, and Governance
QR code data is powerful, but it is not perfect, so attribution needs discipline. A scan may introduce a customer who converts later on another device, or a user may visit the website directly after seeing a code without scanning. To reduce blind spots, combine first party analytics, CRM records, coupon codes, post purchase surveys, and, when available, media mix modeling. For retail, unique redemption codes tied to a QR source can close the loop between scan and sale. For B2B, hidden form fields can capture campaign identifiers and feed lead scoring. Build dashboards that separate operational metrics like code uptime and redirect errors from business metrics like pipeline, revenue, or store visits. Governance matters too. Set expiration rules, ownership, approval workflows, and QA checklists before printing. Every code should be tested across devices, operating systems, camera apps, and network conditions.
The biggest benefit of optimizing campaigns using QR code data is clarity. You can see which message, placement, audience, and destination actually move people to act, then reinvest with confidence. Start with dynamic codes, consistent naming, tagged URLs, and conversion tracking. Measure quality, not just scan volume. Use the findings to refine creative, physical placement, and mobile landing pages. Finally, build reporting and governance that make QR performance visible across marketing, ecommerce, and sales teams. As a hub for QR code analytics and tracking, this topic supports every other mobile QR initiative because good data makes every campaign smarter. Audit your current QR codes, identify tracking gaps, and set up a test plan for the next launch. The brands that win with QR are not the ones with the most codes; they are the ones that learn fastest from the data those scans create.
Frequently Asked Questions
1. What kinds of QR code data should marketers track to optimize campaigns effectively?
To optimize campaigns using QR code data, marketers should track much more than total scan volume. The most useful starting metrics include total scans, unique visitors, repeat scans, device type, operating system, time and day of scan, and approximate geographic location. These data points help reveal not only how many people interacted with a QR code, but also when, where, and on what devices those interactions happened. That context is what turns a QR code from a simple access tool into a campaign intelligence source.
Beyond scan activity, the most valuable insights come from downstream actions. Marketers should connect QR code performance to landing page visits, form submissions, coupon redemptions, purchases, app installs, video views, menu interactions, or any other conversion event that matters to the campaign. For example, a QR code placed on in-store signage may generate many scans, but if few users complete the intended action, the issue may be with the landing page experience, offer clarity, or mobile usability rather than the code placement itself.
It is also important to segment performance by campaign source, creative variation, and placement. A QR code on packaging may behave very differently from one used in direct mail, event signage, posters, or product displays. If each code is uniquely trackable, marketers can compare which channels generate the best engagement and which ones produce the strongest conversion rates. In practice, the best optimization decisions come from combining scan-level analytics with broader campaign KPIs so that QR code activity can be tied directly to business outcomes.
2. How can QR code analytics help improve campaign performance over time?
QR code analytics help improve campaign performance by making it possible to identify patterns, friction points, and high-performing opportunities quickly. Instead of assuming why one campaign worked and another did not, marketers can use scan data to see actual user behavior. If scans spike during certain hours, in specific regions, or on certain device types, campaigns can be adjusted to better align with those patterns. This allows teams to refine messaging, placements, timing, and destination experiences based on evidence rather than intuition.
One of the most practical uses of QR code analytics is identifying where users drop off. For example, if a code receives strong scan volume but weak conversion results, that typically points to a disconnect after the scan. The landing page may load too slowly, the call to action may be unclear, the form may be too long, or the content may not match the expectation created by the QR code’s surrounding message. By comparing scan activity with downstream performance, marketers can isolate whether the issue is audience interest, code visibility, or post-scan experience.
Over time, these insights support a cycle of continuous optimization. Marketers can test different creative treatments, offers, destinations, and placements, then compare the results. A campaign might begin with multiple QR code versions across print ads, packaging, and retail displays, and analytics can reveal which version generates the most qualified traffic. From there, budget and distribution can be shifted toward the top performers. This iterative approach is especially useful for brands using QR codes at scale, where even small improvements in conversion rate or engagement can lead to meaningful gains across many touchpoints.
3. What is the best way to use QR code data for A/B testing and campaign experimentation?
The best way to use QR code data for A/B testing is to assign unique, trackable QR codes to each campaign variation and keep the test conditions as controlled as possible. Each variation should differ in one meaningful way, such as the call to action, visual design, offer, placement, or landing page destination. This setup allows marketers to compare performance accurately and determine which change had the greatest impact on scan rate, engagement, or conversion. Without separate tracking, it becomes difficult to know whether results came from the code itself, the context around it, or the experience after the scan.
For example, a brand might test two poster designs in similar locations: one with a discount-driven message and one with a value-driven message. If the discount version produces more scans but fewer purchases, while the value-driven version produces fewer scans but more completed conversions, the analytics reveal a deeper insight about traffic quality, not just volume. The same method can be applied to different landing pages, short versus detailed forms, video versus static content, or app install prompts versus mobile web experiences.
To get reliable results, marketers should define success metrics before launching the test. In some cases, scan rate is the primary goal. In others, the more important metric may be lead quality, coupon redemption, revenue per visitor, or return visits. QR code data becomes much more actionable when it is tied to a specific optimization objective. The strongest experimentation programs do not stop at identifying a winner once; they use those findings to inform the next round of tests, building a steady improvement process across every QR-enabled campaign.
4. How should marketers adjust landing pages and mobile experiences based on QR code tracking data?
Marketers should use QR code tracking data to shape landing pages around real mobile behavior. Because QR code scans almost always originate from smartphones, the post-scan experience needs to be fast, simple, and immediately relevant. If analytics show high scan counts but short visit durations, low engagement, or poor conversion rates, the landing page may not be meeting user expectations. In many cases, the fix involves reducing page load time, simplifying navigation, making the call to action more prominent, and ensuring the page content matches the promise made where the QR code appeared.
Device type and operating system data are especially helpful here. If iPhone users convert at a much higher rate than Android users, or vice versa, that can indicate device-specific rendering issues, browser compatibility problems, or friction in payment or form flows. Time-of-scan data can also inform content presentation. If users scan primarily during store visits, commutes, or live events, the landing page should prioritize immediate actions such as redeeming an offer, getting directions, viewing product details, or completing a short form. In those contexts, long-form content may reduce performance.
Location and placement data can further improve personalization. A QR code scanned in a restaurant, trade show booth, retail aisle, or package unboxing environment reflects a different user mindset. Marketers who align the landing experience with that context usually see better outcomes. For instance, a QR code on product packaging might work best when it leads to tutorials, registration, or reorder options, while an event-based code may perform better when it opens a sign-up form or exclusive content page. The broader principle is simple: scan data should inform not just where the campaign appears, but what the user sees immediately after engaging.
5. How do you measure the ROI of a QR code campaign using analytics and tracking?
Measuring the ROI of a QR code campaign starts with connecting scan activity to business results. Total scans are useful, but ROI depends on what happens after the scan. Marketers should define conversion events that reflect campaign value, such as purchases, leads, appointments booked, app downloads, coupon redemptions, menu orders, or content sign-ups. Once those actions are tracked, it becomes possible to calculate cost per scan, cost per lead, conversion rate, revenue per visitor, and overall return on campaign spend.
A strong ROI framework also accounts for channel and placement differences. If one QR code appears on direct mail, another on in-store displays, and another on product packaging, each should be measured separately. That allows marketers to compare which environments produce the most efficient results. In some cases, a placement with fewer scans may outperform one with higher traffic because it generates more qualified users or stronger downstream revenue. This is why evaluating only scan volume can lead to misleading conclusions. The real question is not how often the code was scanned, but how much value each scan produced.
For more advanced measurement, QR code data should be integrated with broader analytics platforms, CRM systems, ecommerce tracking, and attribution models. This makes it possible to follow the full customer journey from scan to sale or from scan to repeat engagement. Marketers can then identify assisted conversions, customer segments, and lifetime value trends associated with specific QR campaigns. When QR code analytics are connected to real revenue and customer outcomes, optimization becomes far more precise, and campaign ROI can be demonstrated with confidence rather than estimated through assumptions.