QR code usage statistics for small businesses show a simple truth: quick-response codes have moved from niche marketing tools to mainstream infrastructure for payments, menus, reviews, product information, and customer engagement. A QR code is a scannable two-dimensional barcode that opens a digital destination such as a website, payment screen, coupon, app download, or contact card. For small businesses, the value is practical rather than trendy. A printed sign, package insert, table tent, window decal, or receipt can bridge offline attention to an online action in seconds. That matters because small firms operate with limited staff, tighter marketing budgets, and less room for friction in the customer journey. Over the last several years, I have seen local retailers, restaurants, contractors, and service businesses adopt QR codes first as a pandemic necessity and then keep them because they improved conversion, tracking, and convenience in measurable ways.
The most important statistics are not only the big headline numbers about global scans. Small businesses need to understand which usage patterns affect revenue, retention, and operational efficiency. Relevant metrics include smartphone camera adoption, consumer comfort with scanning in public spaces, scan-through rates by placement, payment adoption, review request performance, menu engagement, and repeat-use behavior. They also need context: a café using dynamic QR codes for loyalty will measure success differently than a home services company placing a code on invoices, vans, and door hangers. This hub article covers QR code usage statistics comprehensively, explains what the numbers mean in plain terms, and shows how small businesses can apply them to marketing, payments, service, and analytics decisions with realistic expectations.
Why QR code usage keeps rising among small businesses
QR code adoption accelerated when smartphone operating systems built scanning directly into native camera apps and consumers no longer needed separate scanner apps. That change removed a major usability barrier. Apple added native QR recognition in iOS 11, and Android camera support became widespread across major device makers, which turned scanning into a default behavior instead of a technical chore. For small businesses, that infrastructure shift mattered more than any advertising trend. When customers can point a camera and tap once, a code on a counter card or package becomes a low-friction call to action.
Consumer familiarity also expanded during the pandemic, when restaurants, health providers, event venues, and retailers used QR codes for menus, forms, and contactless processes. Industry reporting from payment networks, restaurant platforms, and mobile engagement providers consistently showed large increases in scan volume from 2020 onward. The exact totals vary by source because some measure unique users, others total scans, and others campaign traffic, but the directional conclusion is stable: QR code usage became normalized across age groups and business categories. In practice, I now see less hesitation from customers than I did five years ago, especially when the destination is obvious, the landing page loads quickly, and the code is paired with a clear reason to scan.
Small businesses benefit because QR codes collapse steps. Instead of asking someone to type a URL, search for a brand, download a PDF, or fill out a paper form, the business provides a direct path. That efficiency shows up in higher completion rates for actions like joining Wi-Fi, leaving a review, paying an invoice, viewing a service menu, or claiming an offer. The statistics matter because they support a broader operating reality: in local commerce, every extra tap, form field, or page load reduces conversion.
Core QR code usage statistics small businesses should track
When people search for QR code usage statistics, they often expect one universal benchmark. There is no single number that predicts success for every business. The useful approach is to track category-specific metrics and compare them against intent. A restaurant code at the table serves customers already committed to ordering, while a flyer on a community board targets colder traffic. The same scan rate would mean different things in each setting.
| Statistic category | What it measures | Why it matters for small businesses |
|---|---|---|
| Scan volume | Total scans by location, campaign, or asset | Shows which placements get attention |
| Unique scanners | Distinct users rather than total repeat scans | Separates reach from repeated use |
| Scan-through rate | Scans divided by impressions or foot traffic estimate | Helps compare signage, packaging, receipts, and mailers |
| Conversion rate | Percentage of scans that complete a target action | Reveals landing-page quality and offer relevance |
| Time and device data | When people scan and on what device type | Guides staffing, creative timing, and page design |
| Repeat scan rate | How often users scan again later | Useful for loyalty, payment, and support use cases |
For most small businesses, the strongest statistics combine scans with business outcomes. If a salon posts a QR code at checkout for reviews, the meaningful metric is not just scans but completed review submissions and average star rating growth over time. If a contractor puts a code on invoices for card payment, the key statistic is days sales outstanding before and after adding the code. If a boutique includes a code in package inserts, the measure may be repeat purchase rate or loyalty enrollment. Good QR reporting ties the scan to a commercial result.
Dynamic QR codes are especially important here because they allow the destination URL to be changed without reprinting the code and usually include analytics dashboards. Platforms such as Bitly, QR Code Generator Pro, Beaconstac, Uniqode, and Flowcode commonly offer scan counts, device data, location approximations, and campaign tagging. By pairing dynamic codes with UTM parameters and analytics tools such as Google Analytics 4, Search Console landing-page data, HubSpot, or Mailchimp, small businesses can see how scans contribute to sessions, leads, sales, and retention.
Where small businesses use QR codes most effectively
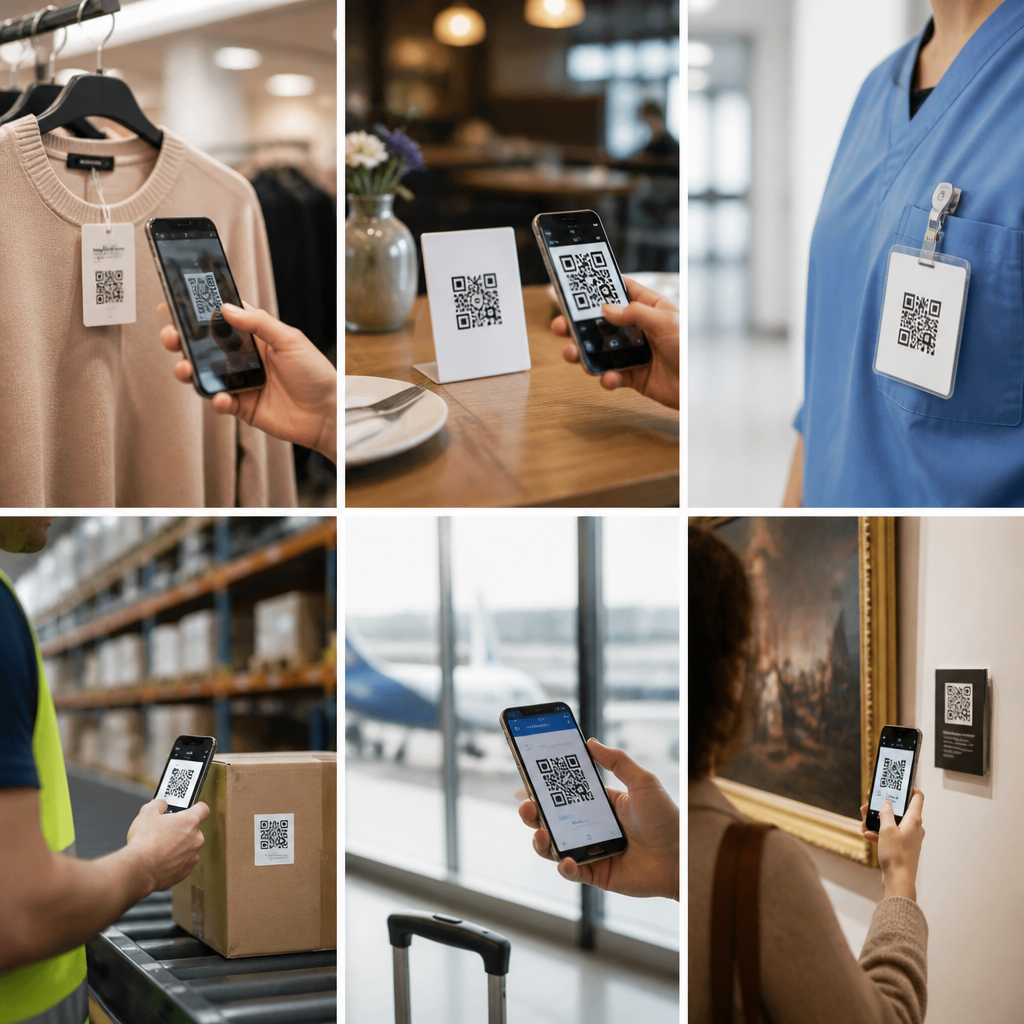
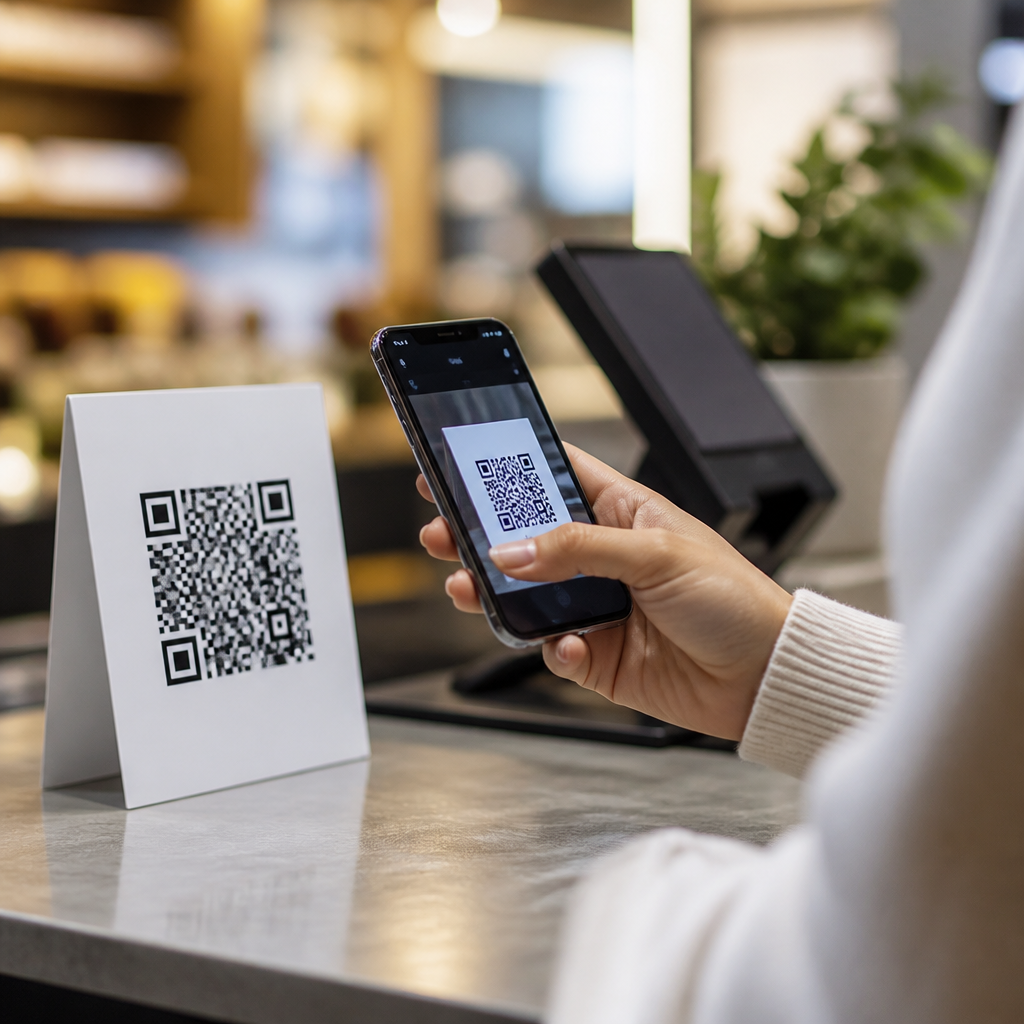
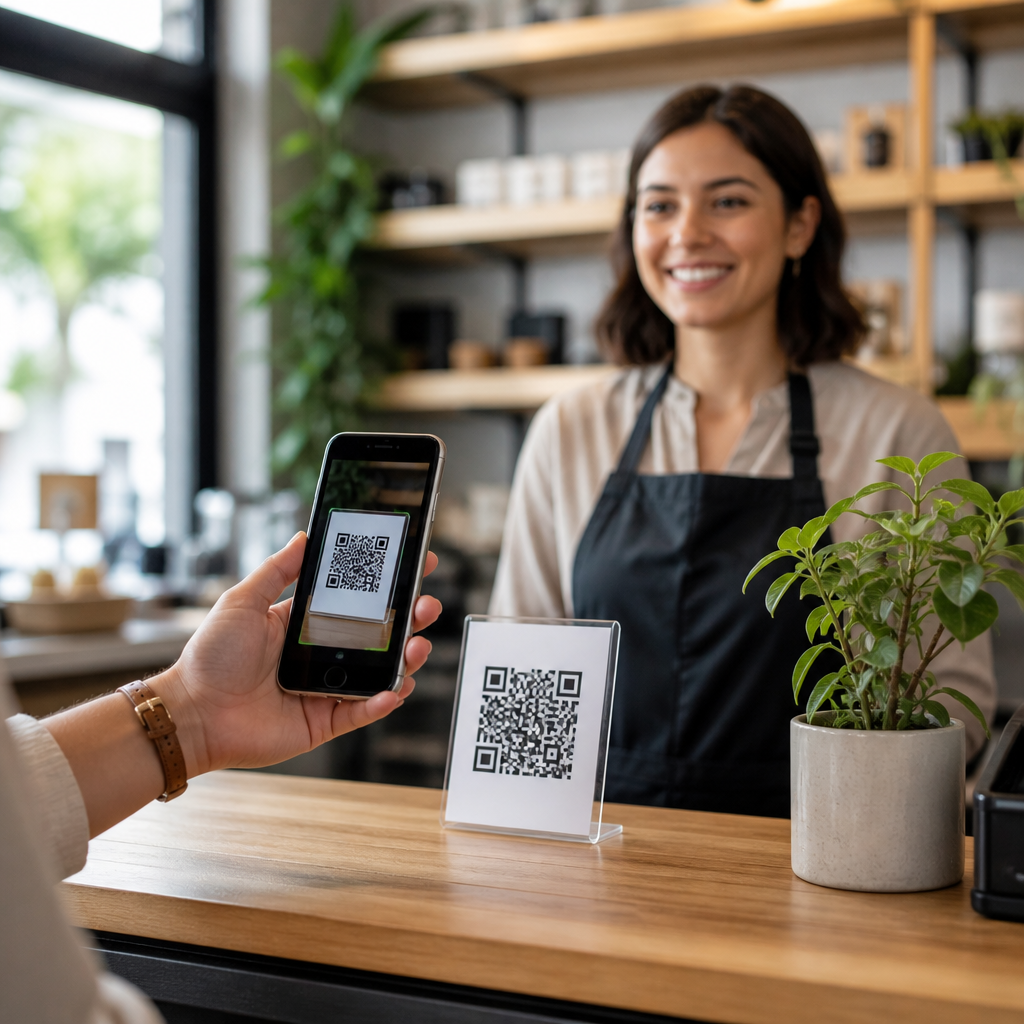
The best QR code usage statistics are tied to concrete placements. In restaurants and cafés, table tents, windows, takeaway packaging, and receipts are common. Menu access remains one of the most familiar use cases, but ordering, tipping, and loyalty enrollment increasingly outperform static menu views because they connect directly to revenue. In retail, shelf talkers, price tags, packaging, fitting rooms, and point-of-sale counters are high-value placements. They can link to product specifications, reviews, care guides, inventory alternatives, or sign-up offers. Service businesses use QR codes on invoices, business cards, yard signs, vehicle wraps, jobsite boards, and post-service follow-up cards. A plumber, electrician, or landscaper often gets stronger ROI from review and payment QR codes than from brochure-style destination pages.
Real-world performance depends on intent and context. A code placed where a customer is already waiting or deciding usually performs better than one placed where attention is split. For example, I have seen review-request codes work well on printed receipts handed over after a positive interaction, but poorly on generic posters near exits. Similarly, packaging inserts can drive repeat scans if the message is specific, such as “Scan for setup video” or “Register for refill reminders,” while vague language like “Learn more” underperforms. Small businesses should assume the code itself is never the offer. The code is only the bridge; the motivation comes from the next action.
Payment use cases deserve separate attention because they are growing quickly across small merchants. Person-to-person systems such as Venmo and Cash App trained consumers to trust QR-triggered payments, while merchant solutions from PayPal, Square, Stripe, and regional wallets expanded acceptance. For very small operators, QR payment statistics often show operational gains beyond direct conversion: fewer manual entry errors, faster reconciliation, and easier remote billing. A market vendor or mobile service professional can collect payment without a traditional countertop terminal, reducing hardware overhead.
What the numbers mean by industry, audience, and channel
QR code usage statistics vary sharply by sector. Restaurants usually produce high scan volume because the code sits in the path of service. Retail often sees lower scan rates but higher information value because shoppers scan when they need details that packaging cannot provide. Health and wellness businesses use QR codes for intake forms, class sign-ups, supplement information, and aftercare instructions. Real estate agencies use them on property signs to capture after-hours interest. Event-driven businesses use them for check-in, schedules, and lead capture. The takeaway is simple: benchmark within your category first, then refine by customer intent and placement.
Audience also changes outcomes. Younger consumers are generally more comfortable scanning quickly, but older audiences are not resistant when the instruction is clear and the benefit is obvious. In local business settings, clarity beats novelty. Adding a short label such as “Scan to book,” “Scan to pay,” or “Scan for care instructions” consistently improves usage because it reduces uncertainty. Trust signals matter too. Codes perform better when they appear on branded materials, use secure HTTPS destinations, and avoid redirect chains that can trigger suspicion.
Channel mix influences analytics quality. Printed codes on storefronts or product packaging are persistent and accumulate scans over time, while digital codes in email, social posts, or PDFs can be swapped more easily and often compete with clickable links. For reporting purposes, small businesses should separate offline-to-online scans from digital scans. Otherwise, they can mistake channel behavior for creative success. A postcard campaign and an Instagram Story may use identical offers, but the scan behavior reflects different levels of user effort and context.
How to improve QR code performance using data
Improving results starts with design and destination quality. A working standard is to keep sufficient quiet zone around the code, maintain strong contrast, test at real viewing distance, and avoid shrinking below practical scan size for the placement. ISO/IEC 18004 governs QR code symbology, but small businesses do not need to study the standard line by line to benefit from it; they need to respect the basic operational implications of error correction, print clarity, and spacing. The destination page should load fast, match the user’s expectation, and ask for the minimum next step.
Data should guide iterative changes. If scans are high but conversions are low, the issue is usually the landing page, offer, or form length rather than the code placement. If scans are low, revise the call to action, size, placement height, or surrounding context. A bakery may test “Scan to pre-order tomorrow’s pastries” against “Scan for weekly specials” and find that the more concrete intent wins. A home cleaner may compare a review code on fridge magnets against one on emailed invoices and discover that the post-service email drives more completed reviews even with fewer total scans.
Small businesses should also build a simple governance process. Name each code by location and purpose, maintain a destination inventory, expire outdated offers, and review scan data monthly. This prevents orphaned codes and broken campaigns, a common issue when staff changes or promotions end.
QR code usage statistics are most valuable when they answer a practical question: where does a scan create less friction, more action, or faster payment for the business and the customer? The evidence across restaurants, retail, services, events, and local commerce is clear. QR codes work best when they connect a specific real-world moment to a specific digital action, and when performance is measured beyond raw scan counts. Small businesses that treat codes as trackable conversion assets, not decorative tech, tend to see better outcomes in bookings, reviews, orders, loyalty, and cash flow.
As the broader QR code trends, statistics, and future landscape evolves, this hub should be your starting point for interpreting usage data in context. Use it to compare industries, placements, and customer behaviors, then drill into supporting articles on payments, marketing, menus, packaging, and analytics. Start with one high-intent use case, implement dynamic tracking, and review the numbers monthly. That disciplined approach turns QR code usage statistics into decisions that improve customer experience and measurable business performance.
Frequently Asked Questions
Why are QR codes becoming so important for small businesses?
QR codes matter to small businesses because they remove friction between a customer seeing an offer and taking action on it. Instead of asking someone to type a long web address, search for a product page, download a file, or manually enter payment details, a business can let the customer scan once and go directly to the intended destination. That destination might be a menu, review page, coupon, scheduling form, loyalty program, contact card, Wi-Fi login, or checkout screen. From an operational standpoint, that makes QR codes useful far beyond marketing. They help businesses reduce printing costs, update information without reprinting every asset, and connect physical locations with digital experiences in a measurable way.
Usage statistics support this shift from novelty to utility. As smartphone camera scanning has become standard and consumers have grown comfortable with contactless interactions, QR code adoption has expanded into everyday business functions. Small businesses in retail, food service, personal care, professional services, events, and home services now use QR codes to streamline customer journeys and collect better engagement data. In practice, the rise of QR codes reflects a broader trend: small businesses increasingly need low-cost tools that can improve convenience, shorten decision time, and make offline marketing trackable. QR codes do all three, which is why they have become mainstream infrastructure rather than a temporary trend.
What do QR code usage statistics typically show for small business adoption?
QR code usage statistics generally show strong and sustained adoption driven by mobile behavior, in-person commerce, and the need for fast digital access. While exact percentages vary by industry, region, and reporting source, the broader pattern is consistent: more consumers are scanning QR codes more often, and more small businesses are using them in multiple parts of the customer experience. Adoption is usually highest in settings where speed and convenience matter most, such as restaurants, retail stores, pop-up events, appointment-based businesses, and service businesses that need to link customers to payments, forms, or follow-up actions.
For small businesses, the most useful interpretation of QR code statistics is not just how many scans happen overall, but where those scans lead and what actions follow. A code on a receipt insert might drive reviews. A code on a storefront sign might generate after-hours orders. A code on packaging might lead to setup instructions, product registration, or repeat purchases. A code at the point of sale might increase loyalty signups or digital payments. In other words, the data tends to show that QR codes are most valuable when tied to a specific business objective. Statistics on scan volume, device usage, conversion rate, repeat scans, and landing page engagement all help businesses understand whether a QR code is simply attracting attention or actually producing revenue, leads, and retention.
How are small businesses using QR codes most effectively today?
The most effective QR code use cases are practical, immediate, and easy for customers to understand. Small businesses see the best results when the code solves a clear problem in the moment. Restaurants use QR codes for menus, ordering, and payments. Retailers place them on shelves, packaging, and window displays to connect shoppers to product details, reviews, inventory, and special offers. Service businesses use them for estimates, appointment booking, invoice payment, and customer feedback. Event-based businesses use them for registration, schedules, maps, lead capture, and social sharing. In each case, the QR code works because it shortens the path between interest and action.
Execution matters just as much as placement. High-performing QR campaigns usually include a direct call to action such as “Scan to order,” “Scan for 10% off,” or “Scan to leave a review.” The landing page should load quickly, work well on mobile, and match the promise made next to the code. Dynamic QR codes are especially valuable because they allow the destination to be updated without changing the printed asset. That is useful for seasonal promotions, rotating menus, campaign testing, and location-specific pages. Small businesses that treat QR codes as part of a broader customer journey, rather than as stand-alone graphics, are typically the ones that get measurable results from them.
What metrics should small businesses track to measure QR code performance?
Small businesses should track more than raw scan counts. Scans are a starting point, but they do not tell the full story. The most important metrics depend on the goal of the QR code. If the code is meant to drive sales, businesses should look at conversions, average order value, and revenue per scan. If the goal is lead generation, they should monitor form completions, booked appointments, or contact saves. If the goal is customer engagement, useful metrics include time on page, repeat visits, coupon redemptions, review submissions, and loyalty signups. Tracking the full path from scan to outcome gives a much more accurate picture of value than scan totals alone.
It is also important to compare performance by placement, audience, and context. A QR code on packaging may perform differently from one on a checkout counter, flyer, direct mail piece, vehicle wrap, or table tent. Time of day, location, offer type, and page design can all affect results. Using trackable links, analytics tags, and dynamic QR code platforms can help businesses segment traffic and test variations. Small businesses should also watch for practical indicators such as bounce rate, page load speed, and device compatibility, since a poor mobile experience can reduce conversion even when scans are high. The most useful statistics are the ones that show whether the code is helping the business save time, increase sales, improve customer service, or strengthen retention.
Are there any common mistakes small businesses should avoid when using QR codes?
Yes, and most of them are preventable. One of the most common mistakes is sending people to a generic homepage instead of a focused landing page. When a customer scans a code, they expect immediate relevance. If they have to search for the offer, menu item, booking form, or payment option themselves, many will leave. Another common mistake is failing to include a clear instruction near the code. A QR code without context often underperforms because customers do not know what they will get by scanning. Businesses should explain the benefit in plain language and make the destination worth the effort, even if that effort only takes a second.
Other frequent problems include poor placement, low print quality, codes that are too small to scan easily, and landing pages that are slow or not mobile-friendly. Some businesses also miss out on valuable data by using static, untracked codes for campaigns that should be measured. Security and trust matter too. Customers are more likely to scan when the code appears on a branded sign, package, or printed material that looks legitimate and professional. Finally, businesses should avoid using QR codes just because they seem modern. The strongest results come when a code serves a real customer need, aligns with a business goal, and is backed by a smooth mobile experience. When those basics are in place, QR code usage statistics become meaningful because they reflect actual business impact rather than passive curiosity.