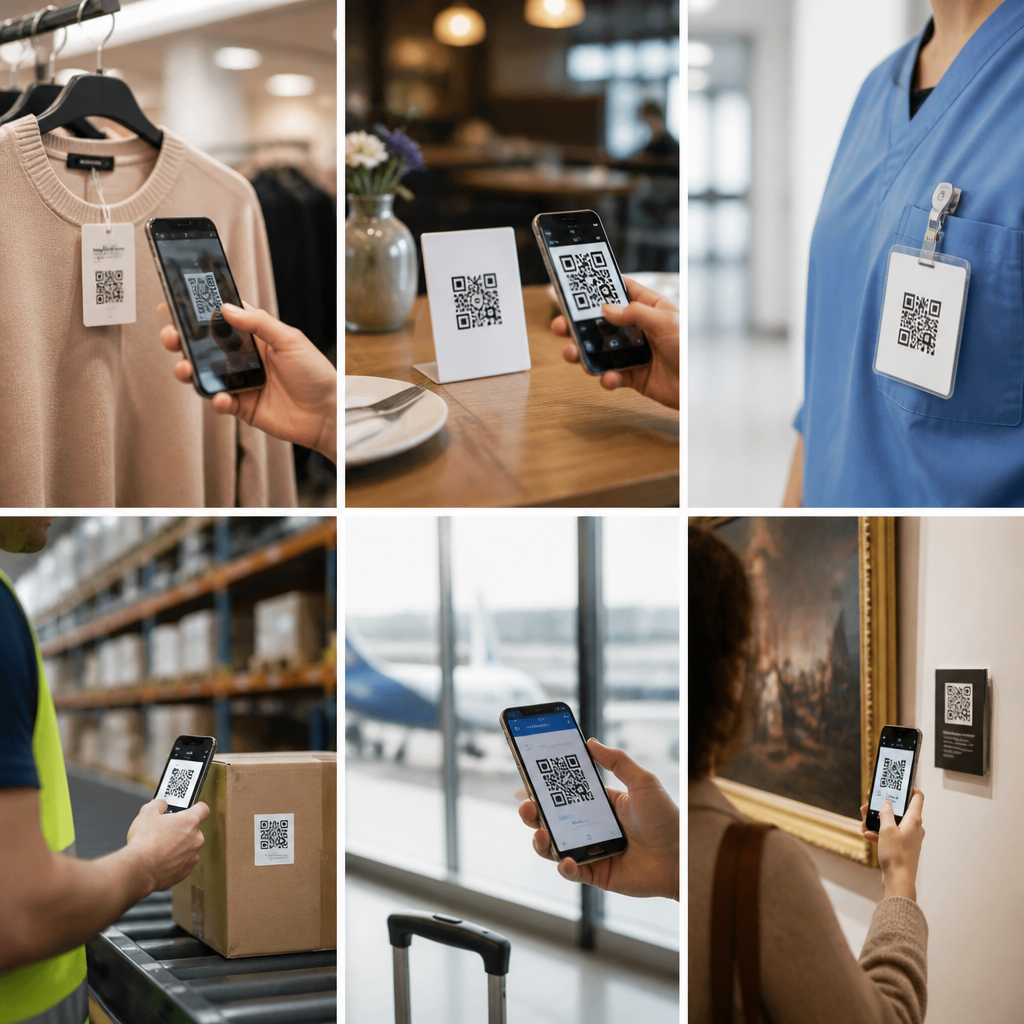
QR code adoption in the U.S. vs global markets reveals a simple truth: the technology is universal, but the reasons people scan, the speed of adoption, and the commercial maturity around those scans differ sharply by region. A QR code, short for Quick Response code, is a two-dimensional matrix barcode that stores data such as a URL, payment credential, app deep link, menu, ticket, or authentication token. When scanned by a smartphone camera or dedicated scanner, it instantly connects a physical object to a digital action. That basic bridge between offline and online behavior explains why QR code usage statistics matter to retailers, restaurants, banks, healthcare systems, event organizers, logistics teams, and marketers.
In my work with campaigns, packaging programs, and contactless customer journeys, I have seen the same pattern repeatedly: a QR code succeeds when it reduces friction better than any alternative. If customers can tap a link more easily, QR underperforms. If they need a fast, low-effort path from poster to payment, package to product data, or receipt to loyalty sign-up, scan rates rise quickly. The U.S. market has grown steadily because smartphone cameras now recognize codes natively and because consumer familiarity improved during the pandemic. Global markets, however, often moved earlier and faster, especially where mobile payments, super apps, and dense urban commerce made scanning part of everyday life.
As a hub for QR code usage statistics, this article compares the U.S. with international markets across payments, marketing, restaurants, transit, authentication, and industrial operations. It also explains what drives adoption, where usage is strongest, and what businesses should measure. The key question is not whether QR codes are popular in the abstract. The practical question is where, why, and under what conditions people actually scan. Understanding that difference helps companies design better campaigns, choose the right QR code platform, and set realistic expectations for engagement, conversion, and long-term retention.
What QR code usage statistics show in the U.S.
In the U.S., QR code adoption accelerated from a niche utility into a mainstream behavior between 2020 and 2024. The tipping point was not the invention of a new standard; it was habit formation. Apple integrated native QR detection in iOS years ago, and Android camera support became common across major manufacturers, removing the need for separate scanner apps. Once menus, vaccine check-ins, payments, and event access relied on scanning, the learning curve largely disappeared. That infrastructure shift matters because adoption statistics are as much about device readiness as consumer intent.
U.S. scanning behavior is strongest in restaurant ordering, product information, retail promotions, app downloads, and payment flows tied to wallets or branded apps. Direct payment by QR remains less dominant in the U.S. than in China or parts of Southeast Asia because card rails are deeply entrenched and tap-to-pay is widespread. Even so, merchant-presented and customer-presented QR payment options continue to expand through PayPal, Venmo, Cash App, bank apps, and point-of-sale systems from Square, Toast, and Clover. In practice, U.S. consumers are comfortable scanning for information first and for payment second.
Marketers in the U.S. also use dynamic QR codes more aggressively than before because they support redirects, campaign edits, scan analytics, and A/B testing. A retailer can place one code on packaging, then change the destination from a launch page to a replenishment offer without reprinting the box. That flexibility makes QR codes especially valuable in direct mail, out-of-home advertising, in-store signage, and connected packaging. U.S. adoption is therefore broad but uneven: consumers scan often, yet the highest performance still comes from contexts where the next step is obvious, immediate, and mobile-friendly.
How global markets moved faster and deeper
Global markets show that QR code adoption can become a default consumer behavior rather than a situational tool. China remains the clearest example. WeChat Pay and Alipay turned QR codes into a daily payment interface for street vendors, supermarkets, taxis, utilities, and peer-to-peer transfers. In that environment, the code was not merely a marketing shortcut; it became core transaction infrastructure. India followed a different but equally significant path through UPI, where QR-based payment acceptance scaled from major chains to small kirana stores because setup costs were low and interoperability was strong.
Elsewhere, adoption patterns vary by use case. In Japan, QR codes gained traction in payments, ticketing, and packaging, building on a long history of mobile interaction with printed codes. In Singapore, Thailand, and Indonesia, tourism, digital banking, and national payment initiatives supported broader merchant acceptance. European markets adopted QR codes heavily in restaurant menus, event ticketing, logistics, and authentication, though contactless cards often remained the primary in-store payment behavior. Latin America saw meaningful growth where fintechs used QR to lower merchant onboarding costs and expand cash-light transactions.
The main global lesson is that adoption rises fastest when QR codes solve a structural problem. That problem may be expensive card acceptance, fragmented merchant technology, low trust in manual data entry, or demand for instant mobile onboarding. Where those frictions are high, QR codes become foundational. Where alternative systems are already convenient, they remain one important channel among several. Businesses comparing U.S. and global performance should therefore avoid assuming one benchmark fits all markets.
U.S. vs global markets by major QR code use case
Comparing QR code usage statistics by use case gives a clearer picture than comparing total scan volume alone. The same code type can perform differently depending on payment culture, regulation, smartphone behavior, and channel design.
| Use case | United States | Global markets |
|---|---|---|
| Payments | Growing, but secondary to cards and NFC in many stores | Primary payment rail in China and significant in India and Southeast Asia |
| Restaurant menus | Mainstream since 2020, now standard in many casual venues | Widely used, often paired with ordering and payment |
| Retail marketing | Strong on packaging, displays, direct mail, and CTV response | Strong globally, often integrated with marketplaces and super apps |
| Transit and ticketing | Common in events and some commuter systems | Broad adoption in rail, metro, and airline workflows |
| Authentication | Used for login, device pairing, and anti-counterfeit checks | Also strong, especially in cross-border commerce and manufacturing |
| SMB merchant adoption | Expanding through POS vendors and wallet apps | Often faster where QR lowers acceptance costs dramatically |
This comparison shows why headline statistics can mislead. A U.S. retailer may report excellent scan engagement on shelf talkers while a Chinese merchant sees most scans tied to payment completion. Both are valid examples of strong adoption, but they indicate different levels of behavioral dependence. For forecasting, use case specificity is essential.
What drives QR code adoption rates
Five factors consistently determine whether QR code usage grows in a market. First is camera-level accessibility. Native scanning eliminates app friction and reliably raises participation. Second is incentive clarity. People scan when the reward is obvious: instant payment, a discount, a menu, a ticket, a warranty registration, or verified product information. Third is destination quality. A slow page, broken redirect, or non-mobile landing page can cut conversion even when the initial scan rate is high.
Fourth is ecosystem support. Payment networks, bank apps, point-of-sale platforms, and messaging apps all shape whether scanning becomes routine. In India, interoperable payment flows mattered more than creative design. In the U.S., integrations with Shopify, Square, HubSpot, and Google Analytics often determine whether businesses can operationalize QR programs at scale. Fifth is trust. Consumers scan more confidently when branding is clear, the context is expected, and the code appears on an official surface rather than an unverified sticker.
I have found that placement and instruction still matter more than many teams expect. A code beside the phrase “learn more” is weaker than one promising “see ingredients,” “pay in 10 seconds,” or “activate warranty.” Good adoption statistics are built through operational detail, not just technology availability.
How businesses should interpret QR code usage statistics
The most useful QR code metrics are not vanity totals. Businesses should track scan rate by impression, unique scans, repeat scans, completion rate after scan, device type, location, time of day, and downstream events such as purchases, form fills, app installs, or account activations. Dynamic QR platforms make that possible, but analytics must connect to broader measurement systems. UTM parameters, server-side redirects, CRM attribution, and event tagging in GA4 or Adobe Analytics are critical if the goal is business insight rather than curiosity.
Benchmarking also requires context. A poster in a subway station, a code on pharmaceutical packaging, and a table-tent in a restaurant will produce different interaction rates because user intent differs. International comparisons need even more caution. Higher scan volume in one country does not automatically mean better campaign execution; it may simply reflect stronger payment habits or a more QR-centric app ecosystem. Strong interpretation means separating environmental effects from creative and operational performance.
For this reason, the best hub pages on QR code usage statistics connect raw numbers to implementation choices. If scan rates are high but conversions are weak, the problem is usually the landing experience. If conversions are strong but scan volume is low, visibility, incentive, or trust is the likely issue. Statistics become useful when they guide a specific improvement.
Where QR code usage statistics point next
QR code growth will continue in both the U.S. and global markets, but the next phase is about integration, not novelty. In the U.S., expect more use in connected packaging, omnichannel retail, digital product passports, healthcare intake, and CTV-to-mobile response paths. Globally, QR codes will keep expanding where instant payments, identity-linked services, and low-cost merchant acceptance remain priorities. Security features such as signed codes, anti-tamper packaging workflows, and authenticated redirects will become more important as fraud attempts increase.
The lasting advantage of QR codes is flexibility. One printed symbol can support payments, education, compliance, loyalty, service, and measurement at once. That is why adoption persists even after emergency-era contactless behavior faded. For businesses building within QR Code Trends, Statistics & Future, the takeaway is straightforward: study the use case, local market behavior, and post-scan experience before chasing broad averages. Start with one high-intent workflow, measure every step, and iterate from real scan data. Done well, QR codes do not just generate clicks. They create a durable link between physical presence and digital action.
Frequently Asked Questions
Why has QR code adoption developed differently in the U.S. compared with global markets?
QR code adoption has followed very different paths because each market has its own mix of consumer habits, payment infrastructure, mobile behavior, and business incentives. In many global markets, especially across parts of Asia, QR codes became deeply tied to everyday payments, messaging apps, transportation, and super-app ecosystems. That gave consumers a clear reason to scan frequently and gave merchants a direct path to monetization. In the U.S., by contrast, consumers already had widespread access to card payments, contactless cards, strong e-commerce habits, and relatively mature app ecosystems, so QR codes did not initially solve an urgent, universal problem at the same scale.
Another major factor is timing. In several international markets, smartphones and mobile wallets expanded at the same time that businesses were looking for low-cost digital infrastructure. QR codes offered an inexpensive bridge between offline and online experiences without requiring costly hardware upgrades. In the U.S., many merchants had already invested heavily in point-of-sale systems, card terminals, loyalty systems, and branded apps. That meant QR codes often entered as an add-on rather than as a foundational tool.
Culture and trust also matter. In some countries, consumers became accustomed to scanning codes for nearly everything, including payments, menus, transit, promotions, identity checks, and account access. In the U.S., early QR campaigns were often inconsistent, leading some users to see codes as marketing experiments rather than essential utilities. Adoption accelerated later when use cases became more practical and frictionless, especially with native smartphone camera support and the pandemic-driven demand for touchless interactions. So while the underlying technology is universal, the pace and maturity of adoption reflect local commercial environments, infrastructure choices, and consumer expectations.
What are the biggest use case differences between QR codes in the U.S. and in other countries?
The most important difference is that in many global markets, QR codes are strongly associated with payments and everyday utility, while in the U.S. they have been more heavily concentrated in marketing, restaurant menus, event access, packaging, and customer engagement. Internationally, consumers may use QR codes to pay a street vendor, board public transit, authenticate a login, add a contact, claim a government service, or interact with a merchant inside a dominant mobile wallet or super-app. In those environments, scanning is often habitual and embedded in daily routines.
In the U.S., QR codes have historically played a more fragmented role. They are widely used for restaurant ordering, digital menus, retail promotions, product information, ticketing, Wi-Fi access, app downloads, and omnichannel marketing. Payment use has grown, but it has not become the single defining use case in the same way it has in some international markets. American businesses frequently use QR codes to connect physical touchpoints to digital destinations such as landing pages, loyalty signups, social media profiles, reviews, and customer service flows.
This creates a different level of commercial maturity. In global markets where payments dominate, QR ecosystems tend to be standardized, reinforced by major platforms, and supported by strong consumer repetition. In the U.S., success often depends more on campaign design, user education, destination quality, and whether the scan delivers immediate value. Put simply, outside the U.S. the scan is often the transaction itself; within the U.S., the scan is often the gateway to the next digital step.
How did the pandemic influence QR code adoption in the U.S. versus global markets?
The pandemic was a major turning point for QR code usage almost everywhere, but its effect was not identical across regions. In the U.S., COVID-19 dramatically accelerated mainstream familiarity with QR codes by making touchless interaction a business priority. Restaurants replaced printed menus with digital menus, venues digitized ticketing and check-in, retailers introduced contactless experiences, and healthcare providers used QR-enabled workflows for forms, scheduling, and patient communication. For many Americans, this period normalized scanning as a practical behavior rather than a novelty.
In global markets where QR codes were already common, the pandemic often deepened existing behavior instead of introducing an entirely new one. Consumers who were already using QR for payments, transit, delivery, or app-based services simply used those systems more frequently. Governments and businesses also expanded QR-based functions for health declarations, entry verification, contact tracing, and public information distribution. In those regions, the pandemic strengthened an already mature digital habit loop.
The long-term result is important. In the U.S., the pandemic created a broad baseline awareness that helped QR codes move from niche marketing tools into mainstream business operations. However, not every emergency-era use case translated into lasting engagement, especially where the post-scan experience was weak or where consumers preferred other channels. In global markets, pandemic-era growth often compounded stronger preexisting ecosystems. That is why the same event boosted adoption worldwide but still produced different maturity levels: the U.S. gained normalization, while many other markets gained scale on top of existing infrastructure.
Are QR codes more commercially mature outside the U.S., and what does that mean for businesses?
In many cases, yes. Commercial maturity refers to how deeply QR codes are integrated into consumer routines, merchant systems, payment rails, analytics workflows, and platform ecosystems. In a number of global markets, QR codes are not just campaign tools; they are a core layer of commerce. Businesses use them for payment acceptance, customer acquisition, loyalty, fulfillment, digital identity, and app engagement, often through standardized systems that consumers already understand. That level of maturity lowers friction because users know what to do and trust the process.
In the U.S., commercial maturity is growing, but it remains more use-case dependent. Some sectors, such as hospitality, events, consumer packaged goods, and omnichannel retail, have developed strong QR strategies. Others still use QR codes inconsistently or tactically rather than strategically. A retailer might place codes on signage, packaging, and shelves, but unless those scans connect to personalized offers, measurable conversions, or a seamless mobile experience, the program may not produce the same value seen in more mature ecosystems abroad.
For businesses, this means strategy should be region-specific. In highly mature markets, companies can assume a degree of consumer familiarity and build sophisticated scan journeys around payment, loyalty, and retention. In the U.S., organizations often need to work harder on user motivation, interface design, trust signals, and post-scan relevance. The lesson is not that one market is better than another, but that execution has to match local expectations. A QR code creates opportunity only when the surrounding customer experience is compelling, fast, and easy to understand.
What should brands and marketers learn from global QR code adoption trends when building campaigns in the U.S.?
The first lesson is that utility consistently outperforms novelty. Around the world, QR codes succeed when they provide immediate, obvious value, such as enabling payment, unlocking exclusive content, verifying authenticity, speeding up check-in, or simplifying reordering. U.S. brands can apply that same principle by avoiding vague calls to action like “scan here” and instead clearly communicating the benefit: “scan to reorder in seconds,” “scan for product verification,” or “scan to unlock your member discount.”
The second lesson is that the destination matters as much as the code itself. High-performing global QR ecosystems typically reduce steps, load quickly on mobile, and align with user intent. U.S. campaigns should do the same by linking to mobile-optimized landing pages, deep links, prefilled forms, wallet passes, store locators, or contextual purchase flows rather than generic homepages. A successful scan experience feels like a shortcut, not a detour.
Third, businesses should think beyond one-time scans. In more advanced markets, QR codes often feed broader systems that include CRM, loyalty, payments, retargeting, and analytics. U.S. marketers can increase ROI by treating QR as a measurable bridge between offline media and digital conversion paths. Dynamic QR codes, A/B testing, location-based performance analysis, and audience segmentation can all help turn scans into actionable business intelligence.
Finally, trust and consistency are essential. Consumers are more likely to scan when the code appears in a credible environment, the brand is recognizable, and the expected outcome is clear. As QR code adoption continues to mature in the U.S., the brands that win will be the ones that design around customer usefulness, not just technical capability. Global trends show that the technology itself is not the differentiator; the real differentiator is whether the scan solves a real problem quickly and reliably.