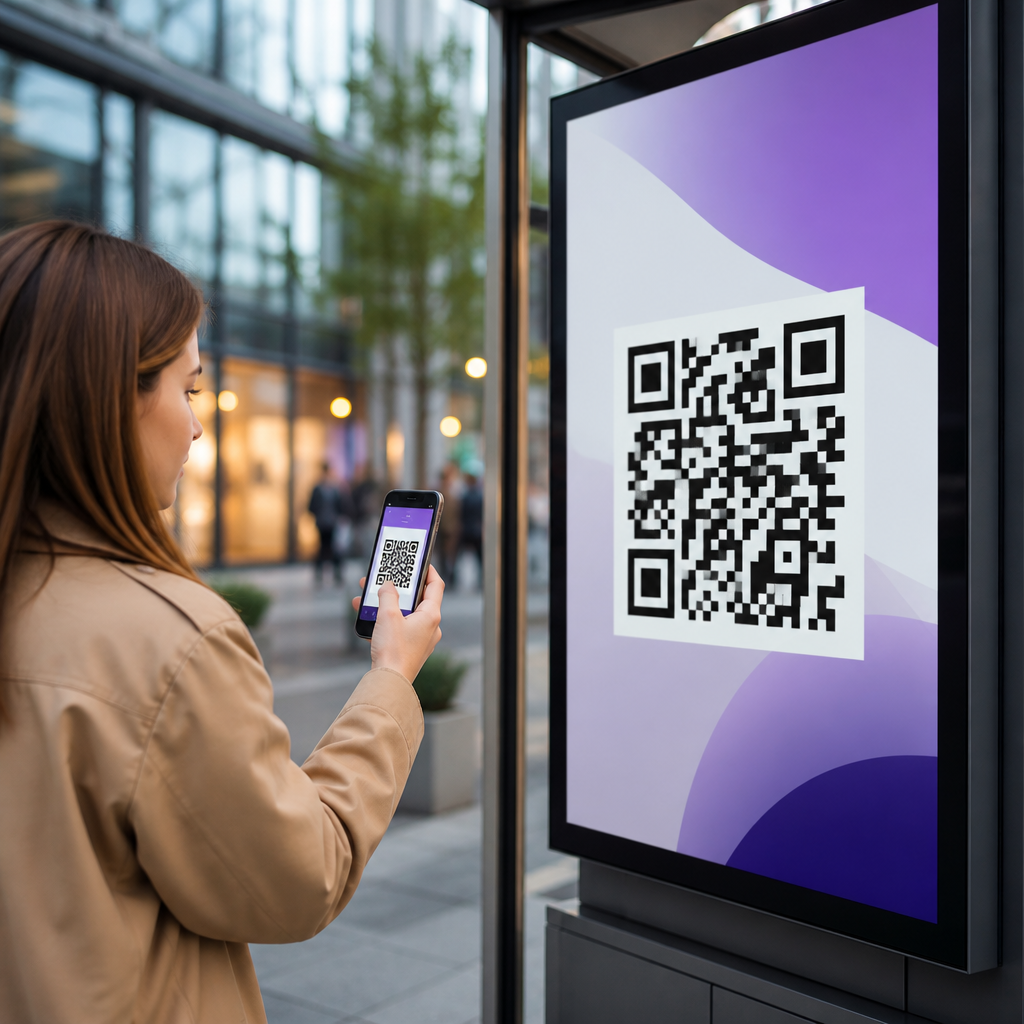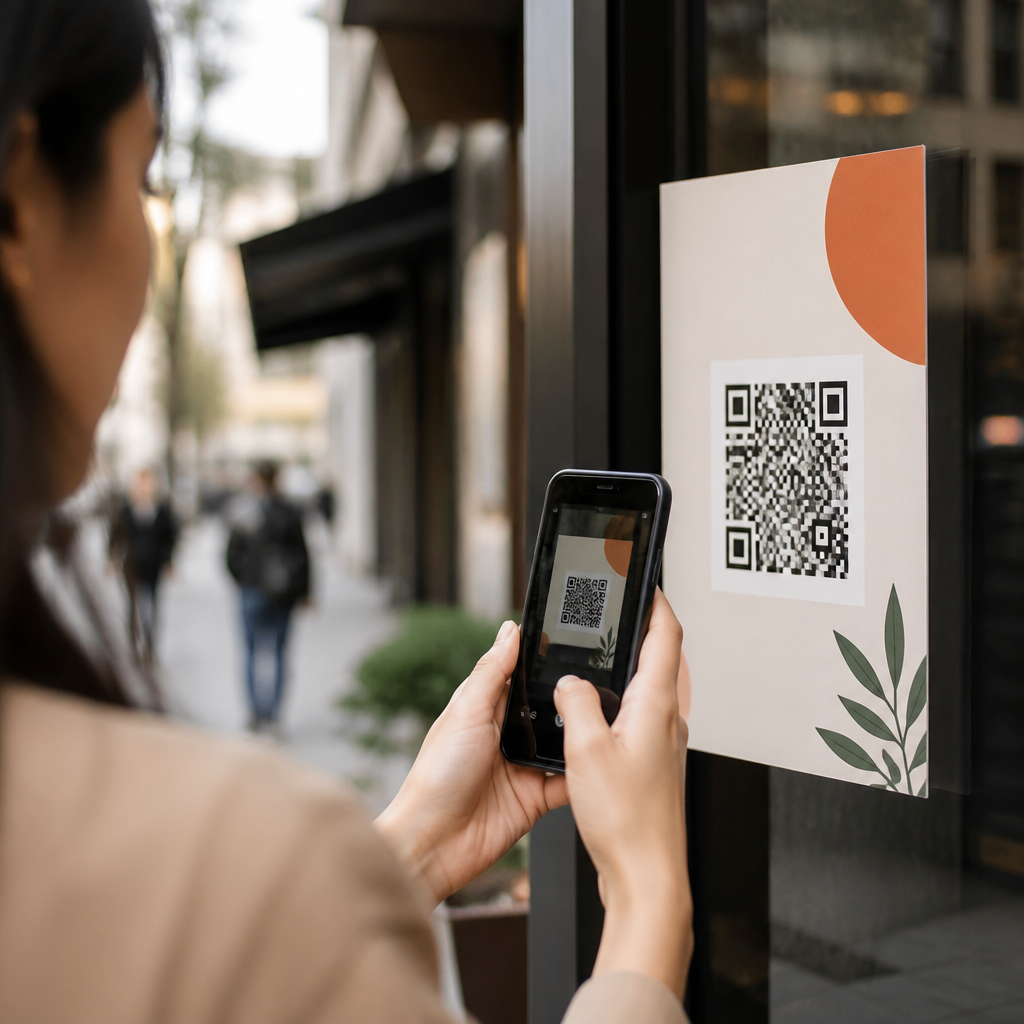

QR code analytics turns a simple square pattern into a measurable marketing asset by showing who scanned, when they scanned, where they scanned, and what happened next. In practice, tracking performance means connecting each QR code to data points such as scan volume, device type, location, campaign source, landing-page behavior, and conversions. For marketers working within mobile campaigns, packaging, out-of-home advertising, retail displays, direct mail, and events, that visibility matters because a QR code without analytics is only a shortcut, while a tracked QR code becomes a testable channel. I have implemented QR programs for print, in-store, and field campaigns, and the same lesson repeats: teams often invest heavily in creative placement but underinvest in measurement design. The result is activity without insight. A strong analytics setup fixes that by defining goals before launch, using dynamic QR codes, tagging destination URLs consistently, and reviewing data in analytics platforms that can attribute business outcomes. This article explains how QR code analytics works, what metrics matter, which tools to use, and how to build a reporting framework that supports smarter decisions across the broader mobile QR code marketing program.
What QR code analytics measures
QR code analytics is the process of collecting and interpreting data generated when a user scans a code and reaches a digital destination. At minimum, most platforms report total scans, unique scans, timestamp, operating system, approximate location based on IP address, and referral context. Dynamic QR code platforms such as Bitly, QR Code Generator Pro, Beaconstac, Uniqode, and Flowcode usually provide this first layer directly in their dashboards because the code points to a redirect URL they control. That redirect records the scan event before sending the user to the final page. Static QR codes do not do this on their own because the destination is fixed in the code itself. If you need serious measurement, dynamic codes are the standard choice because they support edits, campaign segmentation, and event logging without reprinting the asset.
The most common question is simple: what counts as a scan? In most systems, a scan is registered when the redirect URL is requested after a device camera or scanning app interprets the code. A unique scan usually refers to distinct devices within a defined window, though platforms vary in methodology. This is why vendor definitions matter. If one dashboard counts repeat scans from the same device after twenty-four hours and another suppresses them for seven days, direct comparisons will mislead your reporting. I recommend documenting each platform’s counting logic in the campaign measurement plan. That small step prevents confusion later when leadership asks why scan totals differ between the QR vendor, Google Analytics 4, and CRM conversion reports.
Core metrics that indicate performance
The best QR code metrics align with campaign intent. For awareness campaigns, scan rate by placement and total reach matter most. For acquisition campaigns, focus on landing-page engagement, form completions, purchases, booked demos, app installs, or coupon redemptions. In retail environments, scans per store, scans per thousand visitors, and redemption rate often reveal whether the code placement actually influences action. In direct mail, scans by drop date, household segment, and offer version are usually more valuable than raw totals. A QR code printed on packaging may continue generating scans for months, so trend lines and cohort behavior become more important than launch-week spikes.
Useful performance analysis usually moves through a simple sequence: exposure, scans, visits, engagement, and conversion. Exposure is often estimated from circulation, foot traffic, impressions, or unit sales rather than measured directly by the code. Scans show initial response. Visits in GA4 confirm landing-page sessions. Engagement metrics such as engaged sessions, average engagement time, scroll depth, and click-through to key pages show whether the destination matched user intent. Conversion metrics tie the scan to revenue or lead generation. If scans are high but conversions are weak, the issue is rarely the code itself. More often, the landing page is slow, the offer is unclear, or the mobile form has too much friction.
| Metric | What it tells you | Best use case |
|---|---|---|
| Total scans | Overall response volume | Comparing placements or campaign reach |
| Unique scans | Estimated distinct responders | Reducing distortion from repeat use |
| Scan-to-session rate | How many scans became tracked visits | Checking redirect and analytics integrity |
| Engaged sessions | Quality of traffic after the scan | Evaluating landing-page relevance |
| Conversion rate | Share of visitors completing a goal | Measuring business impact |
| Revenue per scan | Monetary value created by each scan | Budgeting and channel comparison |
How to set up tracking correctly
Reliable QR code tracking starts before design and printing. First, define one primary conversion and a small set of supporting metrics. Second, create a dedicated landing page or at least a dedicated tagged URL for each campaign, placement, or audience segment. Third, use dynamic QR codes so destinations can be updated without replacing printed materials. Fourth, apply consistent UTM parameters. A practical structure is utm_source=qr, utm_medium=print or packaging or ooh, utm_campaign with the campaign name, and utm_content for the exact placement such as poster_a, shelf_talker_west, or mailer_offer_b. This naming discipline is what allows GA4 and downstream reporting tools to group scans into meaningful categories.
After URL tagging, verify destination tracking in GA4, Adobe Analytics, or another analytics suite. In GA4, set up key events for conversions such as generate_lead, purchase, sign_up, view_promotion, or custom events tied to button clicks and form submissions. If sales happen offline, connect QR-driven leads or coupon codes to a CRM or point-of-sale system. I have seen teams declare a campaign successful based on scan counts alone, only to learn later that one store manager posted the code beside the register where curious staff kept testing it. Conversion-linked tracking filters out that false optimism. Test the entire chain on multiple devices and networks, inspect redirects, and confirm UTMs persist through consent banners, app opens, and payment gateways.
Tools and platforms that support QR code measurement
Most organizations need a stack, not a single tool. A QR platform handles code creation, redirect management, and scan logging. A web analytics platform tracks on-site behavior. A CRM or commerce platform records lead quality and revenue. Dashboards then combine the data for reporting. For small teams, Bitly plus GA4 may be enough. Mid-market programs often use Uniqode or Beaconstac with Looker Studio dashboards and HubSpot or Salesforce for attribution. Enterprise teams may route events through server-side tagging in Google Tag Manager, store campaign metadata in a warehouse, and join scan activity with store, region, and SKU data.
Platform choice should depend on governance requirements as much as dashboard design. Ask whether the tool supports dynamic codes at scale, folder permissions, SSO, API access, custom domains, bulk generation, expiration rules, and GDPR-conscious data handling. Geographic reporting can be useful, but it is approximate and should not be treated as precise footfall measurement. Also check export flexibility. If a vendor traps scan data inside its interface, you will struggle to blend QR insights with the rest of your marketing reporting. The strongest programs treat QR scans as one interaction point in a larger customer journey, not as a disconnected metric living in a specialty tool.
How to analyze results and improve campaigns
Once tracking is live, analysis should answer operational questions, not just produce charts. Start by comparing placements, creative versions, and offers. A restaurant table tent may outperform a window decal because the diner has time to act. A product box might generate fewer scans than an insert card, but produce higher repeat engagement because it reaches owners after purchase. Time-of-day patterns can reveal event behavior or commuter response. Device splits can indicate whether the experience should prioritize wallet passes, app deep links, or mobile web forms. Segment analysis by city, store, or audience list often surfaces practical changes more quickly than aggregate totals.
Optimization usually comes from testing four levers: call to action, placement, destination, and incentive. A vague prompt like “scan here” consistently underperforms specific language such as “scan for installation guide,” “scan to claim 15% off,” or “scan to see the menu.” Placement matters because line of sight, dwell time, and physical accessibility determine whether scanning is convenient. Destination matters because a generic homepage wastes intent; users should land on the exact information promised beside the code. Incentive matters because people exchange attention for value. When I review underperforming campaigns, the issue is typically one of these four, not the code graphic itself. Continuous testing turns QR usage from a novelty into a dependable response channel.
Common mistakes, privacy limits, and reporting best practices
The biggest mistake in QR code analytics is treating scans as the final KPI. Scans are an interaction metric, not a business result. Other frequent errors include using static codes for changing campaigns, failing to tag URLs, sending users to nonmobile pages, printing codes too small, ignoring redirect latency, and mixing campaign names so reports cannot be compared. Another problem is overinterpreting location data. Most platforms infer geography from IP addresses, which can be skewed by mobile carriers, VPNs, and corporate networks. Treat scan location as directional, not forensic. The same caution applies to unique user counts, which are estimation methods rather than person-level identities.
Privacy and consent also shape what you can track. A QR scan itself does not grant permission for invasive profiling. If the destination uses cookies, forms, or remarketing tags, compliance obligations still apply under regulations such as GDPR and CCPA. Good reporting balances detail with restraint: show trends, conversions, and operational insights without pretending to know more than the data supports. Build a recurring dashboard with campaign metadata, scan trends, landing-page engagement, conversion results, and notes on tests or placement changes. Then review it on a fixed cadence. If you manage QR codes across packaging, retail, direct mail, and events, centralize naming conventions now and audit your current codes. Better structure today will make every future mobile QR marketing decision easier.
Frequently Asked Questions
What is QR code analytics, and what can it actually tell you about performance?
QR code analytics is the process of measuring what happens when people scan a QR code, so the code becomes more than just a link and instead functions like a trackable marketing touchpoint. At a basic level, analytics can show total scan volume, unique scans, time and date of scans, approximate location, device or operating system, and the source campaign tied to that code. More advanced setups can also connect scans to on-site behavior such as page views, time on page, bounce rate, clicks, form submissions, purchases, and other conversion events.
That visibility is what makes QR codes useful across packaging, retail displays, direct mail, event signage, and out-of-home advertising. Rather than guessing whether a printed placement drove engagement, marketers can see whether people scanned, when interest peaked, and which audiences responded best. In practical terms, QR code analytics helps answer questions like: Did this flyer generate traffic? Did shoppers engage with product packaging in-store? Did event attendees scan the booth code and complete a demo request? The value comes from tying an offline interaction to measurable digital outcomes, which makes campaign optimization much more informed and much less speculative.
Which metrics matter most when tracking QR code performance?
The most important metrics depend on the campaign goal, but several core measurements apply almost universally. Scan volume is the starting point because it tells you how often the code was used. Unique scans matter because they help separate repeat activity from broader audience reach. Scan timing can reveal whether performance spikes at certain hours, days, or during specific campaign windows. Location data is valuable for regional campaigns, retail rollouts, transit ads, or event activations because it helps identify where response is strongest.
Beyond scan activity, the most meaningful performance metrics usually come after the scan. Landing-page engagement metrics such as sessions, bounce rate, time on page, scroll depth, and click-through rate show whether the experience matched user intent. Conversion metrics are even more important because they connect scans to outcomes such as sign-ups, purchases, downloads, bookings, coupon redemptions, or contact form submissions. Device type can also matter, especially if the landing page performs differently on iPhone versus Android, or if load speed and mobile UX affect completion rates.
For serious evaluation, marketers should avoid looking at scans in isolation. A code that gets a high number of scans but very few conversions may have strong creative placement but a weak landing page or offer. On the other hand, a code with fewer scans but a high conversion rate may be more efficient and more valuable. The strongest reporting framework combines top-of-funnel metrics like scan volume with mid-funnel engagement data and bottom-funnel conversion results, giving a fuller picture of actual business impact.
How do you set up QR codes so they can be tracked accurately?
Accurate tracking starts with using dynamic QR codes rather than static ones in most marketing scenarios. A dynamic QR code routes users through a managed URL, which allows scan data to be collected and the destination link to be updated later without reprinting the code. This is especially useful for packaging, signage, and print campaigns where assets may remain in circulation for months. Static codes can still be measured to some extent if the destination URL includes analytics parameters, but they are far less flexible and typically provide less insight over time.
To track properly, each QR code should be tied to a clearly defined campaign structure. That usually means assigning unique destination URLs or UTM parameters for each placement, audience, channel, or creative variation. For example, the QR code on a retail shelf display should not use the exact same tracking URL as the code on a direct mail postcard if the goal is to compare performance. Distinct naming conventions in analytics platforms help prevent reporting confusion and make attribution cleaner later on.
It is also important to connect QR code data with your broader analytics stack. That may include web analytics tools, tag managers, CRM systems, ecommerce tracking, and marketing automation platforms. When configured correctly, you can move from simply knowing that a scan happened to understanding whether that scan led to engagement, lead capture, or revenue. Testing is a critical final step. Before launch, scan each code on multiple devices, verify redirects, confirm UTM parameters are passing correctly, and make sure conversion events are recording as expected. Clean setup is what turns QR reporting from a rough estimate into a reliable source of campaign intelligence.
How can marketers use QR code analytics to improve campaigns over time?
QR code analytics is most useful when it informs optimization, not just reporting. Once scan and conversion data starts coming in, marketers can compare placements, messages, offers, and landing pages to identify what is working. If one direct mail version produces significantly more scans than another, that may point to stronger copy, better incentive framing, or clearer call-to-action design. If scans are high but landing-page conversions are weak, the issue may be page speed, mobile usability, message mismatch, or friction in the form or checkout process.
Location and timing data can also guide smarter budget allocation. If scans cluster in specific stores, cities, venues, or times of day, campaigns can be adjusted to focus effort where response is strongest. For event marketing, analytics may show which booth materials, badges, banners, or handouts drive the most engagement. In retail or packaging, scan patterns can reveal whether customers are responding more to educational content, limited-time promotions, loyalty incentives, or product-specific experiences.
Over time, marketers can run structured tests using separate QR codes for different creative versions, product SKUs, print layouts, or audience segments. This makes QR codes a practical bridge between offline experimentation and digital measurement. Instead of relying only on broad campaign outcomes, teams can isolate variables and make evidence-based changes. In that sense, QR code analytics supports continuous improvement: better placement, better messaging, better mobile experiences, and ultimately better conversion performance from physical-world marketing assets.
What are common mistakes to avoid when measuring QR code success?
One of the most common mistakes is treating scans as the only success metric. A scan shows initial interest, but it does not automatically mean the campaign achieved its objective. If the goal is lead generation, product education, coupon redemption, or sales, then downstream actions need to be measured as well. Another frequent mistake is using the same QR code across multiple placements when the campaign requires source-level insight. If one code appears on packaging, posters, mailers, and event signage, it becomes much harder to know which touchpoint actually drove the result.
Poor landing-page experience is another major issue. Many QR campaigns underperform not because the code itself failed, but because the destination page loaded slowly, was not mobile-friendly, lacked a clear next step, or did not match the promise of the scan. Marketers also sometimes forget to test their tracking parameters, redirects, and conversion events before launch, which can lead to lost data and unreliable reporting. Inconsistent campaign naming and missing UTM standards create similar problems by making analysis messy and attribution less trustworthy.
There are also strategic mistakes to watch for. Some teams overlook context, such as scan intent by environment. A user scanning from product packaging may want instructions or ingredients, while someone scanning from an outdoor ad may respond better to a quick offer or store locator. Finally, privacy and compliance should not be ignored. While QR code analytics can provide useful device and location signals, marketers should still handle data responsibly and follow applicable privacy requirements. The best approach is to measure comprehensively, interpret results in context, and optimize based on business outcomes rather than surface-level scan counts alone.