A/B testing QR code placement for higher scans is one of the fastest ways to improve response rates without redesigning an entire campaign. In practical terms, A/B testing means showing two controlled variations to comparable audiences and measuring which version produces more scans, visits, or conversions. QR code placement is the specific decision about where the code appears on packaging, signage, menus, mailers, shelves, screens, receipts, or product labels. This matters because scan behavior is highly sensitive to visibility, distance, lighting, context, and user intent. I have seen the same QR code generate radically different results when moved from the bottom-right corner of a poster to eye level beside a short call to action. Small placement changes alter attention, trust, and ease of use. For marketers, retailers, event teams, and operations leaders, better placement improves campaign efficiency, reduces wasted impressions, and turns QR codes from decorative add-ons into measurable acquisition tools. As a hub topic within advanced QR code strategies, A/B testing QR codes connects design, analytics, customer behavior, and operational execution.
The core principle is simple: placement should be treated as a testable variable, not a creative guess. A scan only happens when three conditions align. First, the person notices the code. Second, they understand why scanning is worth the effort. Third, their device can capture the code quickly in the environment where it appears. If any of those conditions fail, performance drops. That is why serious QR code optimization goes beyond code generation and into experiment design, instrumentation, and statistical interpretation.
When teams ask what affects QR scan rate most, the answer usually includes line of sight, surrounding copy, physical accessibility, competing visual elements, and audience intent at the moment of exposure. Placement sits at the center of all five. A code on a tabletop menu behaves differently from a code on a takeaway bag, even if the offer and destination page are identical. Understanding those differences is the foundation of effective testing.
What to Test in QR Code Placement
The best A/B testing QR codes programs isolate one placement variable at a time. Common variables include vertical position, left versus right alignment, front versus back panel, interior versus exterior window placement, shelf-edge versus product-facing placement, and near-entry versus near-checkout positioning. In print, distance from the main headline and the call to action often changes scans more than color tweaks. In stores, whether the code is reachable without bending or stepping into traffic matters more than many teams expect. On packaging, the choice between a side panel and the primary display panel affects not only scan rate but scan quality, because hurried shoppers often capture imperfect angles.
Context determines which tests matter most. A restaurant may test table tent placement against menu footer placement. A trade show team may compare booth counter placement with badge placement. A direct mail campaign may test a code near the address block against one beside the offer deadline. In each case, the goal is not merely more scans but more qualified scans from users likely to complete the next action, such as signing up, redeeming an offer, viewing product details, or downloading instructions.
A useful rule from field work is to test visibility, motivation, and friction separately. Visibility asks whether the code is seen. Motivation asks whether adjacent copy explains the value of scanning. Friction asks whether the user can comfortably scan in that location with one hand, under real lighting, at natural viewing distance. If you combine all three changes in one test, you may improve results but lose the insight needed to scale the win across channels.
How to Structure a Reliable A/B Test
Reliable QR code placement testing starts with a clean hypothesis. For example: moving the code from the bottom of an in-store sign to eye level will increase scan-through rate because shoppers can capture it without stopping. The primary metric is usually scans divided by impressions, but in mature programs I also track landing page sessions, bounce rate, assisted conversions, coupon redemptions, and revenue per scan. A higher scan rate is useful only if downstream behavior remains strong.
Use dynamic QR codes so each test cell has distinct tracking parameters without changing the visible destination. That lets you compare placements accurately while preserving one canonical landing page. Tools such as Bitly, Google Analytics 4, Adobe Analytics, QR Code Generator Pro, and enterprise digital experience platforms can capture the path from scan to conversion. For physical environments, impression estimates may come from footfall counters, POS traffic, event attendance, or print circulation. Without a denominator, scan counts alone can mislead.
Sample quality matters as much as sample size. If version A is displayed on weekdays and version B on weekends, the test is confounded by audience mix. If one store receives version A and another receives version B, differences in traffic patterns, staff behavior, and demographics can distort results. The strongest retail tests randomize by location cluster or rotate variants evenly across comparable time windows.
| Placement test | Primary metric | Main risk | Best use case |
|---|---|---|---|
| Eye level vs lower panel | Scans per 1,000 impressions | Different traffic flow | Posters, endcaps, kiosks |
| Front package vs side panel | Scan rate and conversion rate | Unequal product facings | CPG packaging |
| Menu top vs footer | Scans per table served | Server explanation bias | Restaurants |
| Checkout counter vs entry sign | Qualified scans and redemption | Different intent stages | Retail promotions |
Statistical confidence is important, but business significance matters too. A two percent lift that saves thousands in print waste can be meaningful. Conversely, a large scan increase that attracts low-intent users may hurt efficiency. Predefine your success threshold before launching the test. I typically recommend a minimum detectable effect based on current scan rate, traffic volume, and campaign value.
Placement Factors That Most Often Increase Scans
Across channels, several placement patterns repeatedly outperform weaker alternatives. The first is proximity to decision moments. People scan when the next step feels immediately useful: while comparing products, waiting for service, checking out, or seeking instructions. A QR code near that moment beats a code placed where attention is diffuse. The second is ergonomic accessibility. If a person must crouch, lean around glare, or hold a product awkwardly, scans fall. The third is contrast and quiet space. ISO/IEC 18004 sets technical expectations for QR readability, but real-world scanning also depends on avoiding clutter around the symbol.
Copy placement is inseparable from QR placement. A code with no explanation often underperforms, while a code paired with a direct benefit such as “See ingredients,” “Join the waitlist,” or “Get assembly steps” lifts intent. On packaging, placing the code near relevant content rather than generic branding usually works better because it answers an immediate question. On signage, aligning the code with the natural reading path helps. In left-to-right languages, codes near the headline end or adjacent to a short action phrase often feel easier to process than isolated corner placements.
Environmental factors also matter. Glossy surfaces create glare. Curved bottles distort the code. Sunlit storefront glass reduces camera acquisition. Large-format out-of-home placements fail when the code is too high or too far to scan safely. A practical rule is to validate scanability with common devices, including older Android models and iPhones with standard camera apps, under the exact lighting and distance conditions users will experience. Laboratory-perfect codes frequently disappoint in the field.
Real-World Examples and Common Testing Scenarios
In retail, a common A/B test compares shelf talkers with endcap signage. Shelf talkers reach shoppers at the point of product evaluation, but the viewing angle can be poor. Endcaps generate stronger visibility, yet not every viewer is interested in the specific item. I have seen shelf talker QR codes produce fewer total scans but better conversion to product detail page views because intent was higher. That result led one brand to keep endcap codes for awareness and move the conversion-focused experience to shelf level.
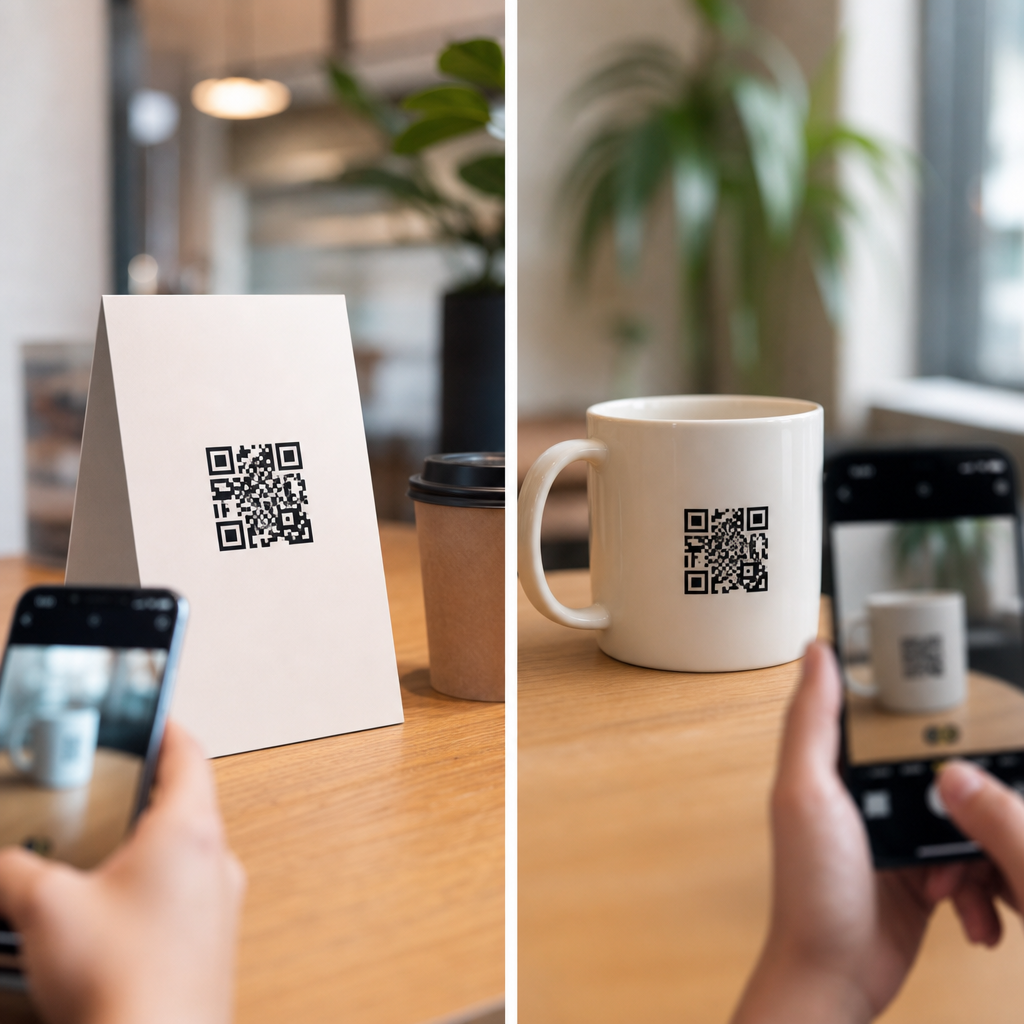
Restaurants often test whether the QR code belongs on the table, menu, receipt, or front window. Table placement usually wins for browsing and ordering because the diner has time and context. Receipt placement can work well for loyalty enrollment or review requests because the transaction is complete. Window placement typically drives lower conversion unless the offer is time-sensitive and visible from the queue. The lesson is that the best placement depends on the action requested, not just the number of eyes on the code.
In events, badge QR codes seem attractive because they travel with the attendee, but they often create awkward scanning mechanics. Booth counter cards or demo screens can outperform badges because they present the code steadily with explanatory copy. For direct mail, one of the strongest tests is exterior teaser versus interior offer placement. Exterior codes may increase curiosity, but interior codes often generate better landing page engagement because the recipient already understands the value proposition.
Measurement, Interpretation, and Scaling Winners
After the test, analyze the full funnel. Start with scan-through rate, then review session quality, conversion rate, and any operational outcomes such as fewer support calls or faster onboarding. Segment by device type, location, traffic period, and audience cohort. Sometimes a placement wins overall but fails for a key segment, such as older devices in low light. That insight can justify a segmented rollout instead of a universal standard.
Do not end with a single winner. Build a testing backlog. Once you identify the strongest broad placement, test supporting elements around it: call-to-action wording, code size, whitespace, destination page speed, and incentive framing. Document every result in a simple experimentation log with hypothesis, setup, audience, duration, metrics, and learnings. Over time, this creates a reusable knowledge base that sharpens future QR code optimization decisions.
A/B testing QR code placement for higher scans works because it replaces opinion with evidence. The strongest programs define a clear hypothesis, isolate one placement variable, measure beyond raw scans, and validate results in real conditions. Placement affects noticeability, motivation, and scan friction, so even minor changes can produce meaningful lifts. The practical takeaway is straightforward: treat every QR code as a conversion surface, not a design ornament. Test where it appears, measure what happens after the scan, and scale only what improves qualified outcomes. If you manage packaging, retail, print, hospitality, or events, start with one high-traffic asset this month, create two placement variants, and let the data tell you where your next scan is hiding.
Frequently Asked Questions
What does A/B testing QR code placement actually mean?
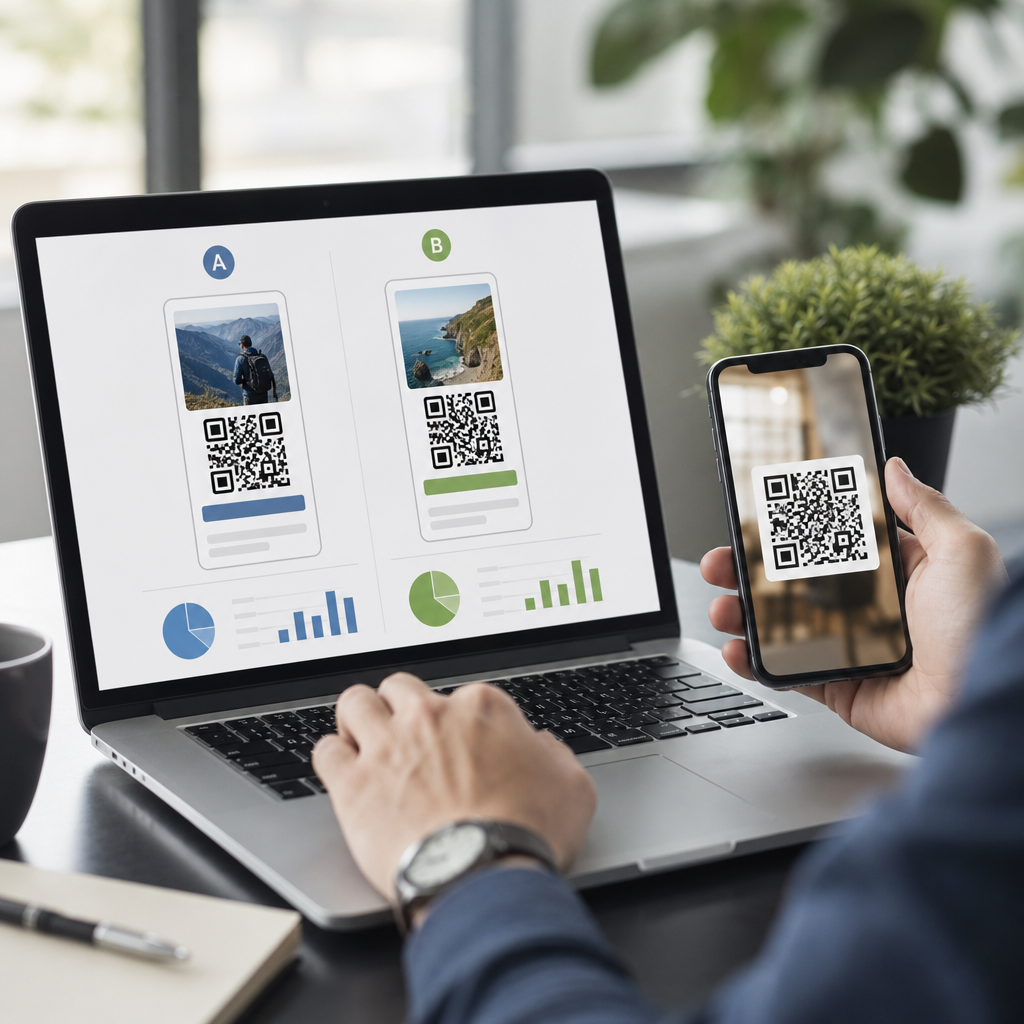
A/B testing QR code placement means comparing two versions of the same asset, offer, or experience while changing only where the QR code appears. The goal is to learn whether one placement generates more scans, site visits, form fills, purchases, or other downstream actions than another. For example, a restaurant might test a QR code at the top of a table tent versus the bottom, or a retailer might compare a code on the front of shelf signage against one placed near pricing information. Because the core message stays the same, you can more confidently attribute differences in performance to placement rather than to copy, color, or offer changes.
This approach is powerful because small location changes can affect visibility, trust, and timing. People scan when the code is easy to notice, appears at a natural decision point, and feels worth the effort. A code hidden in a corner may underperform even if the landing page is excellent, while a clearly placed code next to a compelling call to action can significantly lift response rates. In practice, A/B testing lets marketers improve campaign results without rebuilding the entire creative. Instead of guessing where a code should go, you collect evidence and use real user behavior to guide design decisions.
Why does QR code placement have such a big impact on scan rates?
Placement affects whether people see the QR code, understand why they should scan it, and feel able to scan it in the moment. Scan behavior is highly contextual. On packaging, users may be holding the product in one hand and comparing items on a shelf, so a side-panel code may be harder to engage with than a front-facing code. On posters or window signage, a code placed too low, too high, or too far from the main message may be overlooked. On menus, mailers, receipts, and in-store displays, the best location often depends on the sequence in which people read and interact with the material. Good placement aligns with natural eye flow and the moment of intent.
Placement also influences practical usability. If the QR code is in a reflective area, near a fold, wrapped around a curved container, printed too close to the edge, or positioned where lighting causes glare, scans can drop even when interest is high. The surrounding environment matters too. A code on a shelf tag may perform differently from one on an endcap because shoppers stand at different distances and move at different speeds. In other words, placement is not just a design preference. It affects discoverability, readability, camera accessibility, and motivation. That is why systematic testing often uncovers gains that are larger than teams expect.
What should be the same and what should change in a QR code placement test?
In a strong A/B test, the placement should be the primary variable that changes. Keep the destination URL, QR code size, call to action, incentive, branding, and overall design as consistent as possible unless one of those elements is part of a separate test. If you change multiple things at once, such as moving the code, increasing its size, and rewriting the CTA, you will not know which factor drove the result. Clean test design makes the findings useful and repeatable.
Comparable audiences are just as important. If version A is shown in a busy flagship store on a Saturday and version B is shown in a quieter location on a Tuesday, the results may reflect traffic differences rather than placement quality. Try to balance timing, audience type, inventory conditions, and exposure volume. Use unique tracking parameters or dynamic QR code analytics so each variation can be measured separately. If possible, track not only scans but also follow-up actions such as time on site, purchases, coupon redemptions, or sign-ups. A placement that gets more scans is not automatically better if those scans are low quality. The best test evaluates both response rate and business value.
How long should you run an A/B test for QR code placement, and what metrics matter most?
You should run the test long enough to collect a meaningful sample and smooth out short-term fluctuations. The exact duration depends on traffic volume, expected scan rate, and the stakes of the decision, but the principle is simple: do not stop the test just because early numbers look promising. QR scanning behavior can vary by day of week, store traffic, weather, seasonality, event timing, and audience mix. A test that runs across representative conditions will produce more trustworthy conclusions than one based on a brief spike.
The most obvious metric is scan rate, usually measured as scans divided by impressions, visits, or exposure count depending on the setting. But scan rate should not be the only metric. You should also look at conversion rate after the scan, bounce rate, completion rate on the landing page, revenue per scan, and any offline outcomes tied to the campaign. For example, one placement might generate fewer scans but more purchases because it reaches higher-intent users at the right decision moment. In many cases, the strongest business outcome comes from balancing visibility with intent rather than simply maximizing raw scan volume. If the campaign has enough volume, statistical significance should also be considered so you can separate real performance differences from random variation.
What are some practical best practices for improving QR code placement after testing?
Start by placing the QR code where attention naturally goes and where scanning is physically convenient. On print assets, that usually means avoiding corners that compete with legal text or cluttered design elements. On signage, keep the code at a height and distance that makes mobile scanning easy. On packaging, favor flatter, more visible panels over curved or heavily reflective surfaces. Pair the code with a clear call to action that explains the benefit, such as accessing a menu, claiming a discount, watching a demo, registering a product, or getting instructions. People are far more likely to scan when the next step is obvious and valuable.
After your test, apply the winning placement consistently, but continue refining based on context. What works on a countertop display may not work on a mailer or receipt. Review heatmaps, traffic patterns, scan timestamps, device data, and downstream conversion behavior if available. Also validate technical basics: sufficient white space around the code, strong contrast, reliable destination pages, fast load speed, and mobile-friendly landing experiences. In many campaigns, the biggest gains come from combining smart placement with friction reduction. The lesson from A/B testing is not just “move the code higher” or “put it near the product image.” It is to treat placement as a measurable performance lever, test it methodically, and optimize around how real people notice, approach, and use QR codes in the environments where they encounter them.