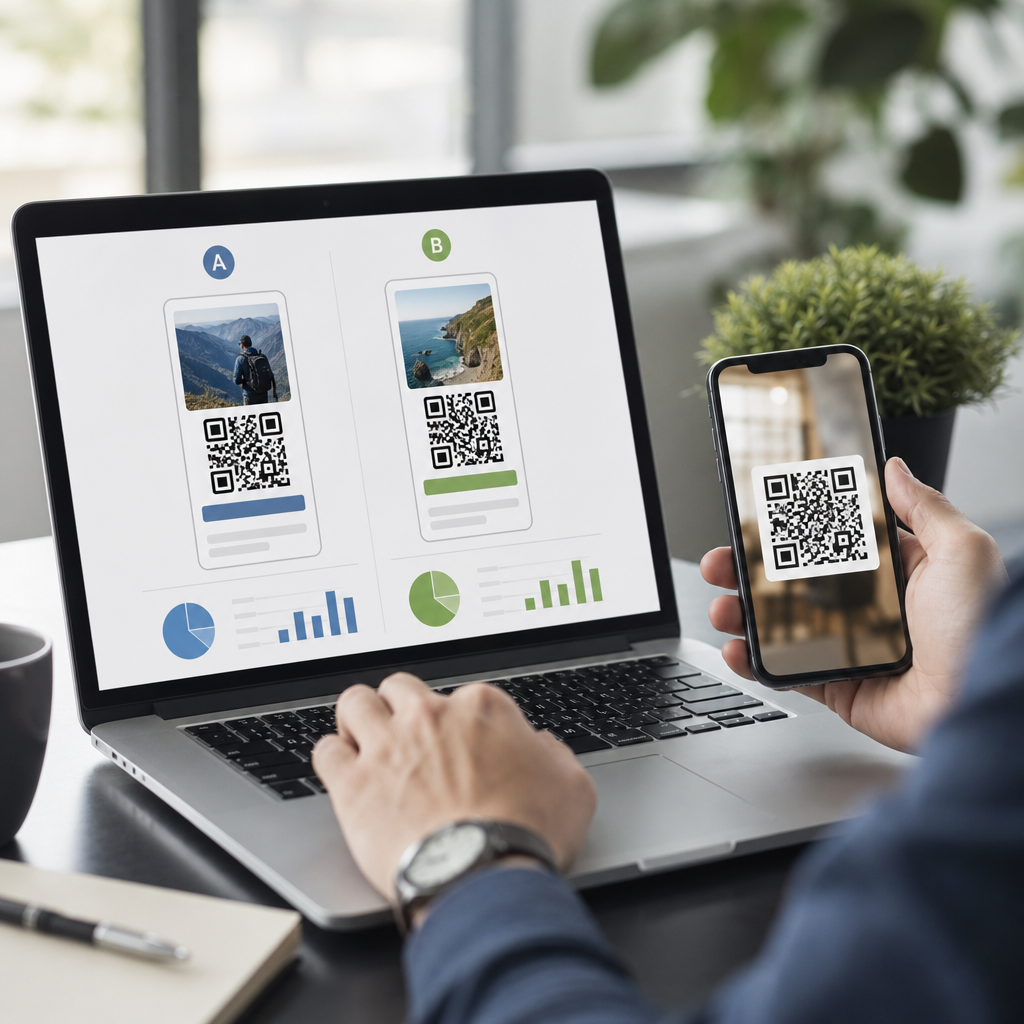
QR code campaigns are easy to launch and notoriously hard to optimize without disciplined testing. If you want better scan-to-conversion performance, you need to run split tests on QR code landing pages, not just redesign them based on opinion. In practice, A/B testing QR codes means sending comparable traffic to two or more landing page variants, measuring what changes user behavior, and deciding with evidence. I have used this approach across packaging, retail signage, event badges, direct mail, and restaurant table tents, and the same lesson keeps repeating: the QR code gets the scan, but the landing page determines whether the scan becomes revenue, a lead, or a completed action.
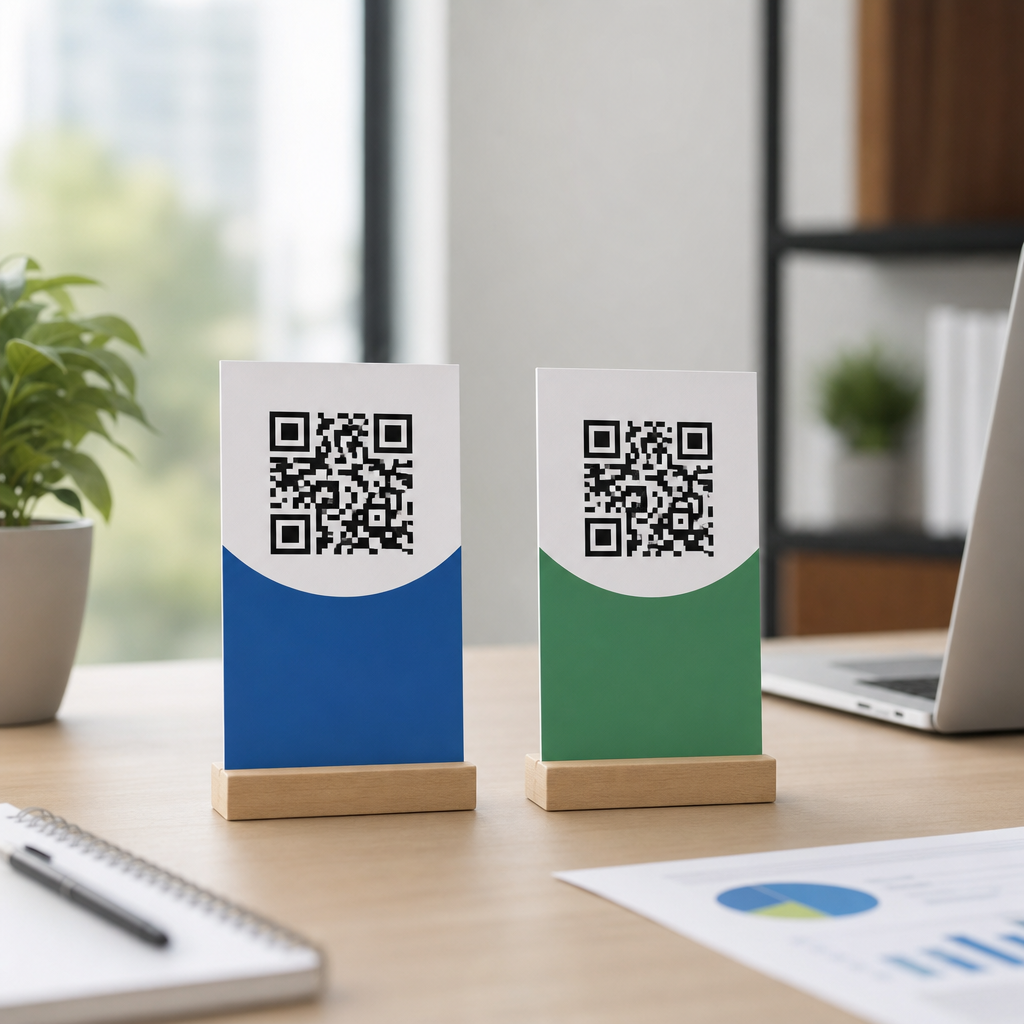
A split test compares a control against a variation while holding the rest of the experience as steady as possible. On QR code landing pages, that usually means testing one meaningful difference at a time: headline, offer framing, form length, product image, call-to-action button, trust signals, page speed improvements, or mobile layout. Because nearly all QR traffic is mobile traffic, the landing page must be evaluated through a mobile-first lens. A page that looks acceptable on desktop previews can still fail on actual devices because of slow image loads, awkward thumb reach, oversized forms, or poor contrast under outdoor glare.
This matters because QR traffic often comes from high-intent contexts. Someone scanning from product packaging, an in-store display, a printed postcard, or a trade show booth has already taken a physical action. That intent is expensive to generate and easy to waste. If your landing page confuses visitors, asks for too much information, or mismatches the promise near the code, conversion rates fall quickly. Well-structured testing helps you identify what actually improves outcomes, shorten decision cycles, and build a repeatable optimization process for every future QR campaign under your advanced QR code strategy.
Start with the Right Test Design and Success Metric
The first step in A/B testing QR codes is defining the business outcome before you build variants. Too many teams test cosmetic changes without agreeing on the primary metric. For a lead generation page, the primary metric may be form completion rate. For an ecommerce campaign, it may be add-to-cart rate, checkout completion, or revenue per scan. For a restaurant QR menu promotion, it might be coupon redemption rate. Secondary metrics still matter: bounce rate, average engagement time, scroll depth, page load time, and error rate can explain why a variation wins or loses.
Use a simple hypothesis format: “If we change X for scanners arriving from Y context, we expect Z metric to improve because of A user behavior.” For example, on a direct mail QR campaign for home services, I tested a headline emphasizing “Book in 60 Seconds” against one emphasizing “Free Same-Day Estimate.” The faster-action message won form starts, but the estimate-focused message produced more qualified leads. That result mattered because the business cared more about booked appointments than raw lead volume. A good test design protects you from celebrating the wrong win.
You also need traffic discipline. Split tests require enough scans to produce directional confidence. If a code on a limited print run generates only 80 sessions, do not pretend the result is definitive. In lower-volume campaigns, focus on larger changes with larger expected impact, or aggregate similar traffic sources. Tools such as Google Analytics 4, Google Tag Manager, VWO, Optimizely, Convert, and Adobe Target can support experiment setup, event tracking, and analysis, but your implementation must be clean. Broken UTM parameters, inconsistent event names, and duplicate conversions will invalidate the test long before statistics become the problem.
Build Landing Page Variants Around Real QR User Behavior
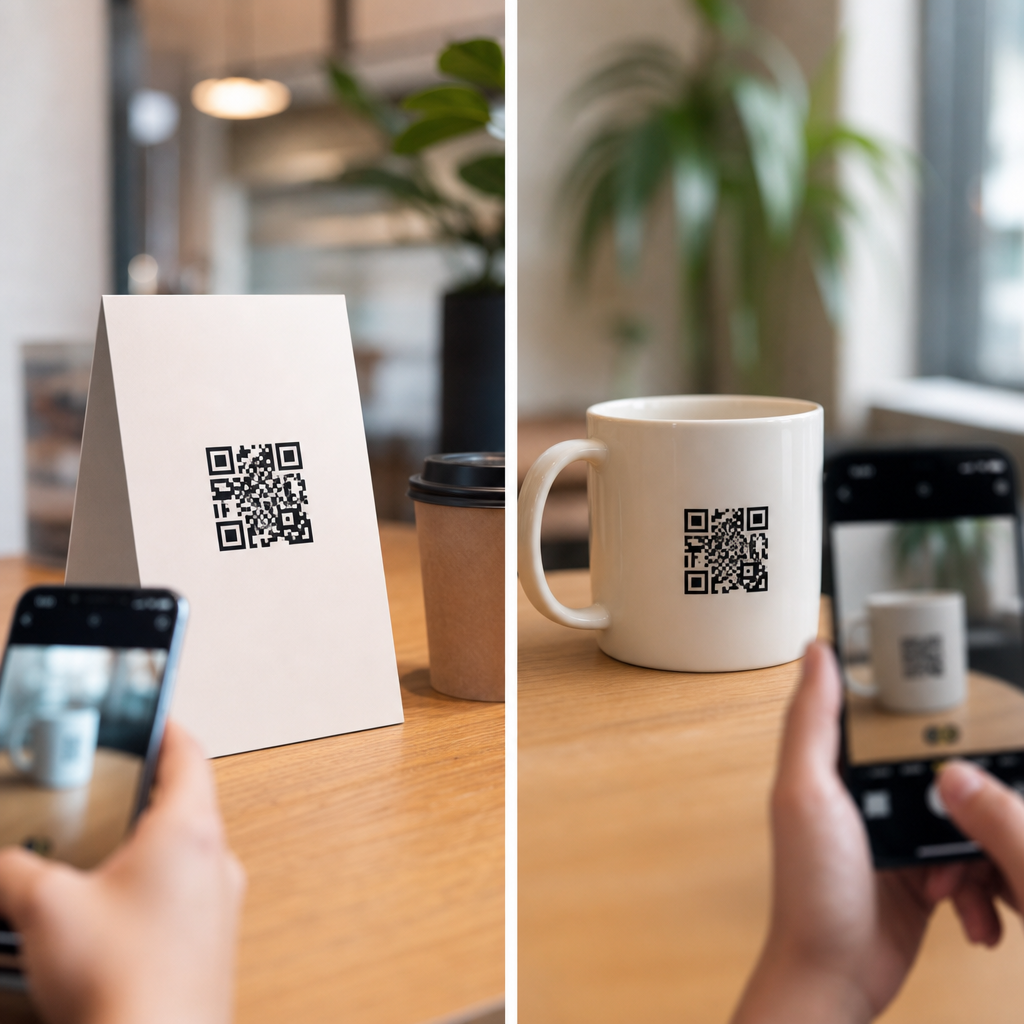
QR visitors behave differently from many other website visitors because the scan happens in a physical context. That context shapes intent, urgency, and expectations. A customer scanning a code on cereal packaging may want recipe ideas or loyalty rewards. A conference attendee scanning a booth code may want a spec sheet or a fast demo request. A patient scanning a clinic poster may want directions, hours, or appointment scheduling. Effective landing page variants are built around those use cases, not around generic website best practices copied from desktop campaigns.
The highest-impact variables usually relate to message match and friction. Message match means the landing page should instantly confirm what the user expected when scanning. If the sign says “Scan for 15% off today,” the page headline should repeat that offer clearly above the fold. Friction includes every obstacle between arrival and completion: slow pages, tiny tap targets, cluttered hero sections, required account creation, or forms with eight fields when three would do. I have seen a single-field reduction lift QR lead conversion by double digits when the audience was standing in a store aisle with limited attention.
Prioritize mobile-specific elements first. Test compressed hero images with next-generation formats such as WebP, stronger contrast on buttons for outdoor environments, sticky CTA buttons, autofill-friendly forms, Apple Pay or Google Pay for fast checkout, and local trust signals such as reviews, store availability, or delivery times. If the QR code appears on packaging in multiple regions, localized variants often outperform generic versions. For multilingual audiences, a language selector that appears before the main CTA can reduce confusion, but only if it does not interrupt users who are already in the correct language experience.
What to Test First on a QR Code Landing Page
Most teams should begin with variables that influence comprehension and action within the first few seconds. In QR campaigns, the strongest early tests are usually headline, subheadline, offer structure, CTA wording, form length, page speed, and social proof placement. Visual polish matters, but clarity usually beats decoration. A page that explains the benefit in one line and gives the user one obvious action routinely outperforms a beautiful but ambiguous design.
| Element to Test | Why It Matters for QR Traffic | Example Variant | Primary Metric |
|---|---|---|---|
| Headline | Confirms the scan promise immediately | “Claim 15% Off Today” vs “Unlock Your In-Store Discount” | Conversion rate |
| CTA button copy | Reduces hesitation on small screens | “Get Coupon” vs “Show My Discount” | Click-through rate |
| Form length | Limits mobile friction | 3 fields vs 6 fields | Form completion rate |
| Trust signals | Builds confidence quickly | Reviews near CTA vs below fold | Lead quality or sales |
| Load speed | Prevents abandonment on mobile networks | Compressed media vs heavy hero video | Bounce rate |
Do not test everything at once unless you are running a structured multivariate experiment with enough traffic. In most QR scenarios, traffic is limited and contexts vary, so single-variable or tightly grouped tests are safer. A product label campaign in grocery retail may have radically different user behavior from a tabletop code in a quick-service restaurant. Use separate experiments or at least segment reporting by placement. When one “winning” version is driven by only one context, rolling it out globally can lower overall performance.
Set Up Tracking, Segmentation, and Statistical Guardrails
Reliable measurement is what turns A/B testing QR codes from guesswork into operational practice. Every variant should have a clear event taxonomy. At minimum, track scans, landing page sessions, engaged sessions, CTA clicks, form starts, form submits, purchases, revenue, and any downstream quality indicator such as qualified lead status or appointment attendance. In Google Analytics 4, define conversions carefully and validate them in DebugView or through Tag Assistant before a campaign launches. I also recommend storing the QR placement, creative version, and distribution date in parameters or hidden fields so analysis can tie conversion behavior back to the real-world asset.
Segmentation is essential because QR performance is highly context dependent. Break down results by source placement, device type, operating system, geography, time of day, and returning versus new visitors. A page variation may win overall but fail badly on older Android devices because of rendering issues or script weight. Likewise, a landing page that converts well from direct mail may underperform from shelf talkers because in-store users need faster actions and shorter copy. If you do not segment, you may optimize for an average user who does not really exist.
Statistical discipline matters too. Decide in advance how long the test will run, what minimum sample size you need, and what effect size would be meaningful for the business. Avoid peeking every few hours and stopping as soon as one variant appears ahead. That inflates false positives. If volume is low, use longer test windows and sanity checks with Bayesian or frequentist tools, but keep interpretation grounded in business reality. A 3% lift in click rate means little if completed purchases decline. The winning page is the one that improves the metric chain that matters, not the prettiest dashboard screenshot.
Common Mistakes That Distort QR Landing Page Test Results
The biggest mistake is testing the landing page while ignoring the QR code’s surrounding creative. If one printed asset says “Free Sample” and another says “Learn More,” the traffic intent is different before users ever hit the page. That is not a clean landing page split test. Another common problem is changing multiple variables during the run, such as editing the CTA, replacing images, and speeding up the page in the same week. Once the environment changes midstream, your comparison becomes unreliable.
Teams also underestimate operational issues. Cached versions, delayed print distribution, broken redirects, and inconsistent dynamic QR code settings can skew results. I have seen campaigns where one variant accidentally loaded over an extra redirect hop, adding enough latency to hurt conversions. Others forgot to exclude internal traffic from store staff testing the code. Compliance can matter too, especially in healthcare, finance, and regulated promotions. Consent language, disclosure placement, and data collection rules may limit how aggressively you simplify a form or personalize content.
Finally, do not declare a permanent winner too early. User behavior changes by season, offer fatigue, and placement quality. A landing page that wins in a holiday retail environment may lose in February when urgency drops. Treat every strong result as a new baseline, then continue testing. Build a library of learnings by campaign type, such as packaging, OOH, event, direct mail, and in-store signage. That library becomes the real strategic asset because it helps future QR launches start from proven patterns instead of resetting to opinion each time.
Running split tests on QR code landing pages is the fastest way to improve scan value without increasing media or print spend. Define one clear business metric, create variants based on real scan context, measure every step cleanly, and segment results by placement and device. Start with high-impact elements like headline, offer, CTA, form length, and speed, then expand into trust signals, localization, and checkout flow. The strongest QR programs do not rely on instincts alone; they build evidence from repeated experiments across campaigns.
The main benefit is simple: better landing pages turn existing scans into more leads, sales, bookings, and redemptions. That makes every package insert, poster, postcard, shelf tag, and event badge work harder. As the hub for A/B testing QR codes within an advanced QR code strategy, this approach should connect to your deeper workflows for QR analytics, dynamic QR management, campaign attribution, and mobile conversion optimization. Review your top QR traffic source, launch one focused test this month, and document the result so your next campaign starts smarter.
Frequently Asked Questions
1. What does it actually mean to run split tests on QR code landing pages?
Running split tests on QR code landing pages means comparing two or more versions of a page to see which one produces better results from the same kind of QR traffic. Instead of guessing whether a different headline, call to action, form length, layout, image, offer, or page structure will improve performance, you send comparable visitors to different landing page variants and measure what happens. The goal is to learn which version gets more people to complete the action you care about, whether that is making a purchase, submitting a form, redeeming an offer, downloading an app, booking a demo, or signing up for an event.
In a QR campaign, this matters because scans often happen in very specific contexts such as product packaging, in-store signage, posters, event badges, table tents, direct mail, or print ads. People scan with limited attention, often on mobile, and usually because something about the physical placement prompted immediate curiosity or intent. That means small changes on the landing page can have a major effect on whether users continue or drop off. A disciplined split test lets you isolate those changes and determine which version works better under real-world conditions.
The key is that the comparison must be fair. If one version is shown mostly to people scanning from a retail shelf and another is shown mostly to people scanning from an email insert, the result may reflect different audience intent rather than a true page improvement. Strong split testing controls the traffic source as much as possible, randomizes exposure, defines a primary conversion metric before launching, and gathers enough data to make a confident decision. In short, split testing QR code landing pages is not about experimenting casually. It is about building evidence for what improves scan-to-conversion performance.
2. What elements should I test first on a QR code landing page?
The best elements to test first are the ones most likely to affect user behavior quickly and meaningfully, especially on mobile devices. In most QR campaigns, the first priorities are headline clarity, offer presentation, call-to-action wording, page speed, visual hierarchy, trust signals, and form friction. People who arrive from a QR code rarely want to decode a complicated page. They need immediate confirmation that they landed in the right place and that taking the next step will be simple and worthwhile.
A strong first test often compares different value propositions in the headline and subheading. For example, one version might emphasize a discount, while another emphasizes convenience or exclusive access. Another high-impact area is the call to action. A button labeled “Get My Offer” may outperform “Submit,” and “See Available Options” may outperform “Learn More” when users are closer to decision than discovery. If your page asks for information, reducing the number of form fields is also a common and effective test because QR traffic is usually mobile-first and less tolerant of typing effort.
You should also test whether the page content matches the context of the scan. Someone scanning a QR code on product packaging may respond better to usage tips, warranty registration, or a loyalty reward, while someone scanning at an event may care more about speaker details, schedule access, or lead capture. Visual choices matter too. A cleaner hero section, fewer distractions, more prominent benefits, or a different image can influence whether users stay engaged. However, test one meaningful variable or one tightly related set of changes at a time. If you alter the headline, image, button copy, layout, and offer all at once, you may improve results, but you will not know what caused the lift. Start with the elements closest to intent and friction, because those usually produce the fastest and most actionable insights.
3. How do I set up an A/B test for QR code traffic without contaminating the results?
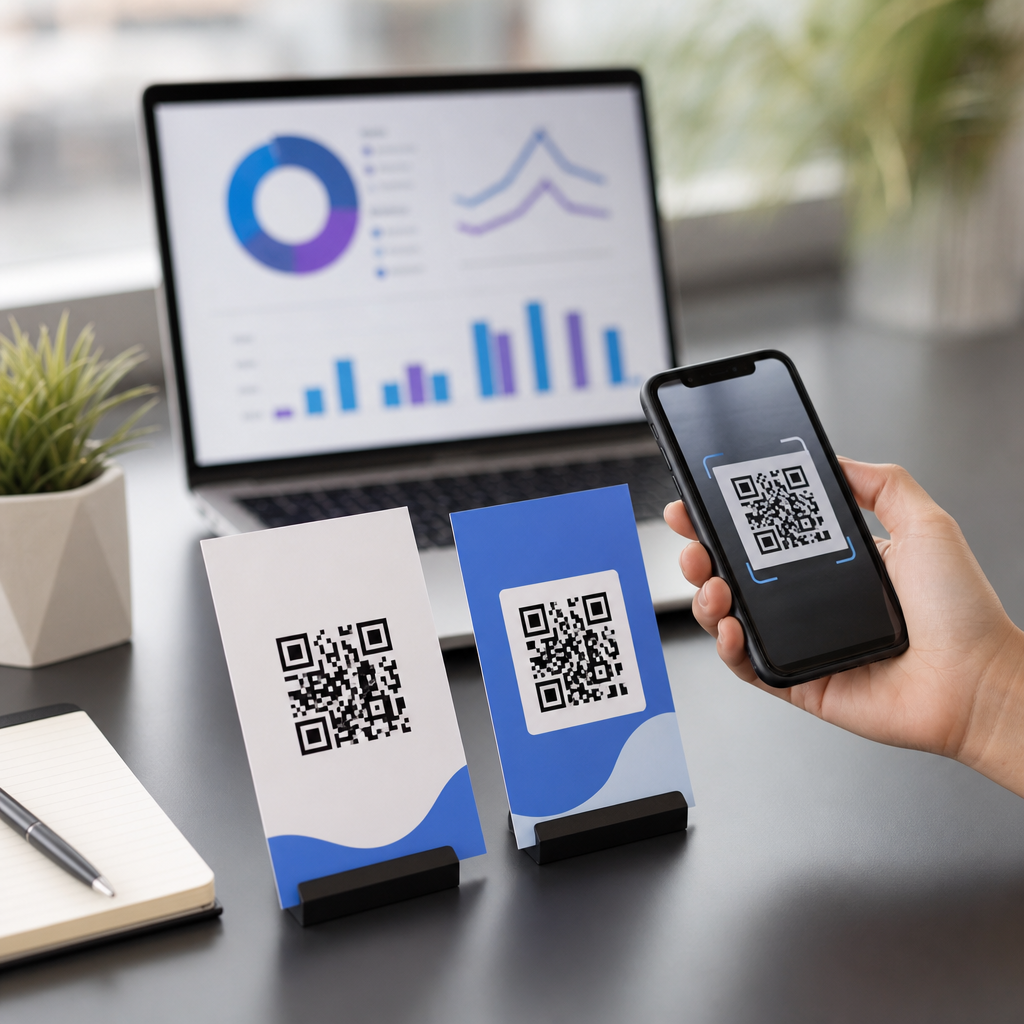
The cleanest way to set up an A/B test for QR code traffic is to use a single scan destination that routes visitors randomly to one of two landing page variants. This avoids printing multiple QR codes that might be distributed unevenly or scanned under different conditions. Ideally, one QR code points to a test URL, and your testing platform, redirect logic, or optimization tool assigns each visitor to version A or version B according to a fixed traffic split such as 50/50. That routing should happen consistently and quickly so the user experience remains seamless.
To avoid contaminating the test, keep everything except the landing page variant as constant as possible. Use the same QR code creative, same placement, same surrounding copy, same campaign dates, and same promotional context. If you are testing across packaging, retail signage, event badges, and direct mail at the same time, segment those sources in your analytics so you can compare like with like. What works for one physical context may not work for another, and blended reporting can hide important differences. It is also important to define your primary conversion event before the test starts. That might be purchase completion, email signup, coupon redemption, or click-through to another step. If you wait until after data comes in and then choose whichever metric looks best, your result becomes less trustworthy.
You should also watch for technical issues that distort outcomes. Make sure both variants load equally fast, render well on common mobile devices, and preserve tracking parameters. Confirm that analytics, event tracking, and attribution are working on every version before sending live traffic. If possible, exclude internal traffic and repeated quality assurance scans from the reporting. Finally, let the test run long enough to account for normal variation in behavior by day, location, or scan environment. A short burst of scans might produce a misleading winner. Good QR landing page testing depends as much on setup discipline as on creative ideas.
4. What metrics matter most when evaluating QR code landing page split tests?
The most important metric is the one closest to the business outcome you actually care about. For some campaigns, that is completed purchases. For others, it might be qualified lead submissions, appointment bookings, app installs, brochure downloads, loyalty signups, or coupon redemptions. That primary conversion metric should guide the decision. While softer metrics such as bounce rate, time on page, scroll depth, or button clicks can be helpful diagnostic signals, they are not substitutes for a true business result. A version that gets more clicks but fewer completed actions is not really better.
That said, QR code landing page optimization often benefits from a layered view of performance. Start with scan volume, then examine landing page visit rate, engagement, next-step clicks, form starts, form completions, and final conversions. This helps you identify where friction appears in the journey. For example, if both variants get similar scans but one has a much lower bounce rate and a higher form-start rate, you may be improving message clarity. If users start the form but fail to submit it, the issue may be friction or trust. If clicks rise but purchases do not, the problem may sit downstream rather than on the tested page itself.
Context also matters when interpreting metrics. QR traffic is usually mobile and often action-oriented, so page speed, load completion rate, and device-specific conversion rate can have outsized importance. Segment by source, placement, device type, geography, and time of day when relevant. A page that wins overall may perform poorly in one high-value channel. Also pay attention to statistical confidence and sample size before declaring a winner. Early results can be noisy, especially if scan volume is low. The best practice is to choose one primary KPI, define a few supporting metrics, and evaluate both performance and reliability before making a permanent rollout decision.
5. How long should I run a QR code landing page split test, and how do I know when to stop?
You should run a QR code landing page split test until you have enough data to make a reliable decision, not until one version appears to be winning after a small number of scans. The exact duration depends on traffic volume, baseline conversion rate, the size of the improvement you hope to detect, and how variable user behavior is across the campaign period. If your QR code gets thousands of scans per day, you may reach a meaningful conclusion relatively quickly. If scans are limited to a niche event, seasonal print run, or lower-volume retail environment, the test may need substantially more time.
A practical rule is to avoid stopping too early based on incomplete data. QR scans can fluctuate by day of week, store traffic, event schedule, weather, promotional timing, and audience context. If you stop after a strong first weekend or after a single event session, you may lock in a false winner. It is generally better to let the test run through a full cycle of relevant conditions so both variants are exposed to similar patterns. You should also ensure the sample includes enough conversions, not just enough visits, because decision quality comes from outcome data.
You know it is time to stop when three conditions are met: you have reached an adequate sample size, the observed difference is statistically credible or directionally stable enough for your decision framework, and the result aligns with the business metric you established before launch. If the difference between versions is tiny, the right decision may be that there is no meaningful winner and that you should test a bigger change. Split testing is not only about finding winners. It is also about eliminating weak ideas, learning what influences user behavior, and building a repeatable optimization process for future QR campaigns. The best teams do not run one test and stop. They use each result to inform the next hypothesis and steadily improve scan-to-conversion performance over