How to A/B test QR code campaigns starts with a simple idea: treat every scan as measurable behavior, not just a vanity metric. In practice, A/B testing QR codes means showing two or more versions of a code, placement, landing page, or call to action to similar audiences, then comparing which version produces more of the outcome you care about, such as scans, form fills, purchases, app installs, or store visits. I have run these tests across packaging, direct mail, retail signage, and event booths, and the same rule always applies: a QR code campaign improves fastest when the variable is isolated and the success metric is defined before launch. That matters because QR codes bridge offline media and digital conversion paths, where small design or messaging changes can produce large differences in response and revenue.
For marketers working under the broader Advanced QR Code Strategies umbrella, this hub article explains the full method for A/B Testing QR Codes, the metrics that matter, the tools to use, and the mistakes that invalidate results. It also serves as a practical map for related subtopics, including QR code landing page optimization, dynamic QR code tracking, print placement testing, attribution modeling, and post-scan funnel analysis. If your campaigns already generate scans but results feel inconsistent, structured experimentation is the discipline that turns QR codes from a convenient access point into a repeatable performance channel.
What A/B Testing QR Codes Actually Means
A/B Testing QR Codes is the controlled comparison of two campaign variants where one meaningful difference is introduced and all other conditions stay as similar as possible. Variant A might use a code placed on the front of packaging, while Variant B places the code on the side panel. Or both versions may use the same printed code but point to different mobile landing pages using dynamic redirection. The principle is consistent: one change, one primary metric, one audience split, one decision rule.
In QR campaigns, the test can happen at four levels. First is scan generation: code size, quiet zone, color contrast, surrounding copy, and placement influence whether people notice and trust the code enough to scan it. Second is scan quality: not every scan is equal, so you evaluate unique visitors, bounce rate, dwell time, and return visits. Third is conversion performance after the scan: checkout starts, coupon redemptions, lead submissions, or account creations. Fourth is downstream value: average order value, repeat purchase, retention, and offline sales matched back through campaign identifiers.
The strongest QR tests usually use dynamic QR codes because the printed asset stays constant while the destination, analytics tags, and routing logic change behind the scenes. Platforms such as Bitly, QR Code Generator Pro, Beaconstac, Uniqode, and Flowcode support dynamic links, scan analytics, device breakdowns, geolocation reporting, and UTM parameter handling. For post-scan behavior, Google Analytics 4, Adobe Analytics, Mixpanel, or Amplitude are standard choices. When retail redemption or CRM outcomes matter, HubSpot, Salesforce, Klaviyo, and Shopify data often complete the picture.
What You Should Test First in a QR Code Campaign
The best starting point is not the QR code pattern itself but the highest-friction point in the journey. In my experience, teams often obsess over color or shape before fixing weak offers or confusing landing pages. Start by asking where performance breaks. If impressions are high but scans are low, test the call to action, placement, code size, and visual prominence. If scans are healthy but conversions are weak, test the destination page, page speed, trust signals, form length, and offer clarity. If conversions occur but revenue is poor, test audience targeting, product-page continuity, or post-click merchandising.
Common high-impact variables include surrounding CTA copy like “Scan for 15% off” versus “Scan to see today’s deal,” incentive type such as discount versus exclusive content, landing page format like short-form page versus product collection, and physical placement such as eye level versus checkout counter. In direct mail, outer-envelope teaser text can affect scan intent before the recipient even sees the insert. On product packaging, testing front label placement against back label placement often reveals major differences because shoppers notice codes differently in aisle browsing than at home after purchase.
Use one primary KPI per test. For awareness media, that may be scan-through rate, defined as scans divided by estimated impressions or circulation. For acquisition, use completed lead rate or cost per lead. For commerce, use revenue per 1,000 impressions or purchase conversion rate from unique scanners. Secondary metrics help diagnose why a variant won, but they should not overturn the primary KPI after the fact. When teams change the definition of success midstream, they usually end up selecting noise rather than a true winner.
How to Design a Valid Test and Avoid Bad Data
A valid QR experiment needs clean audience splitting, sufficient sample size, and disciplined control of external factors. The simplest method is geographic or inventory-based splitting. For example, send Version A inserts to half of zip codes and Version B to the other half, matched by historical response rates. In retail, assign stores by comparable foot traffic and demographics rather than alternating randomly without context. At events, rotate signage by time blocks only if booth traffic patterns are stable; otherwise, staffing or agenda changes may distort results.
Statistical significance matters, but practical significance matters more. A version that improves scans by 3% may be statistically real and financially irrelevant. Before launch, define the minimum detectable effect worth acting on, such as a 10% lift in scans or a 5% lift in completed purchases. Also define the stopping rule. Peeking daily and ending the test the moment one version looks better increases false positives. Most campaign teams should commit to a fixed duration, or a fixed sample threshold, then evaluate once.
| Test Element | Version A | Version B | Primary Metric | Common Risk |
|---|---|---|---|---|
| CTA copy | Scan to learn more | Scan for 20% off | Unique scan rate | Offer changes user intent |
| Placement | Front of package | Back panel | Scans per 1,000 units | Different visibility at shelf and at home |
| Landing page | Short product page | Collection page | Purchase rate | Inventory or price changes during test |
| Code size | 1.5 cm | 2.5 cm | Successful scan rate | Poor print quality masks the effect |
Bad data usually comes from five sources: mixed variables, broken redirects, inconsistent print quality, weak attribution, and environmental bias. If one flyer version has different copy, a different offer, and a different landing page, you cannot tell what caused the lift. If redirect latency is high or pages fail on spotty mobile connections, scan intent gets lost before conversion. If matte and glossy print runs reproduce contrast differently, readability changes independently of your intended test. QR code testing is unforgiving of sloppy execution.
Metrics, Attribution, and the Tools That Reveal Winners
The most useful metrics follow the user through the entire funnel. Start with total scans, unique scans, successful scan rate, device type, operating system, and time of day. Then connect these to landing page engagement metrics such as engaged sessions, scroll depth, add-to-cart rate, form completion, and purchase conversion. In omnichannel campaigns, tie scans to coupon redemptions, loyalty sign-ups, or in-store transactions using promo codes, customer identifiers, or point-of-sale integrations. Without this step, teams optimize for curiosity instead of business outcomes.
Attribution deserves special care because QR codes often influence action across channels. A shopper may scan from packaging, leave, then purchase later via desktop search. To preserve signal, use UTMs consistently, pass campaign IDs into hidden form fields, and store first-touch and last-touch source values in your CRM. GA4 event mapping should distinguish scan landing sessions from generic direct traffic. For retail, match redemptions using unique offer codes tied to each variant. If privacy rules limit user-level tracking, analyze at cohort level by store, geography, or print batch.
Tool choice depends on complexity. A lightweight setup may use a dynamic QR platform plus GA4 and Looker Studio dashboards. Mid-market teams often add HubSpot or Klaviyo to see lead quality and revenue. Enterprise programs may use Adobe Analytics, Segment, BigQuery, and warehouse models for incrementality analysis. The important point is consistency. Every variant should follow the same naming convention, parameter structure, and event schema, or reporting becomes too messy to trust.
Real-World Testing Scenarios That Produce Actionable Insights
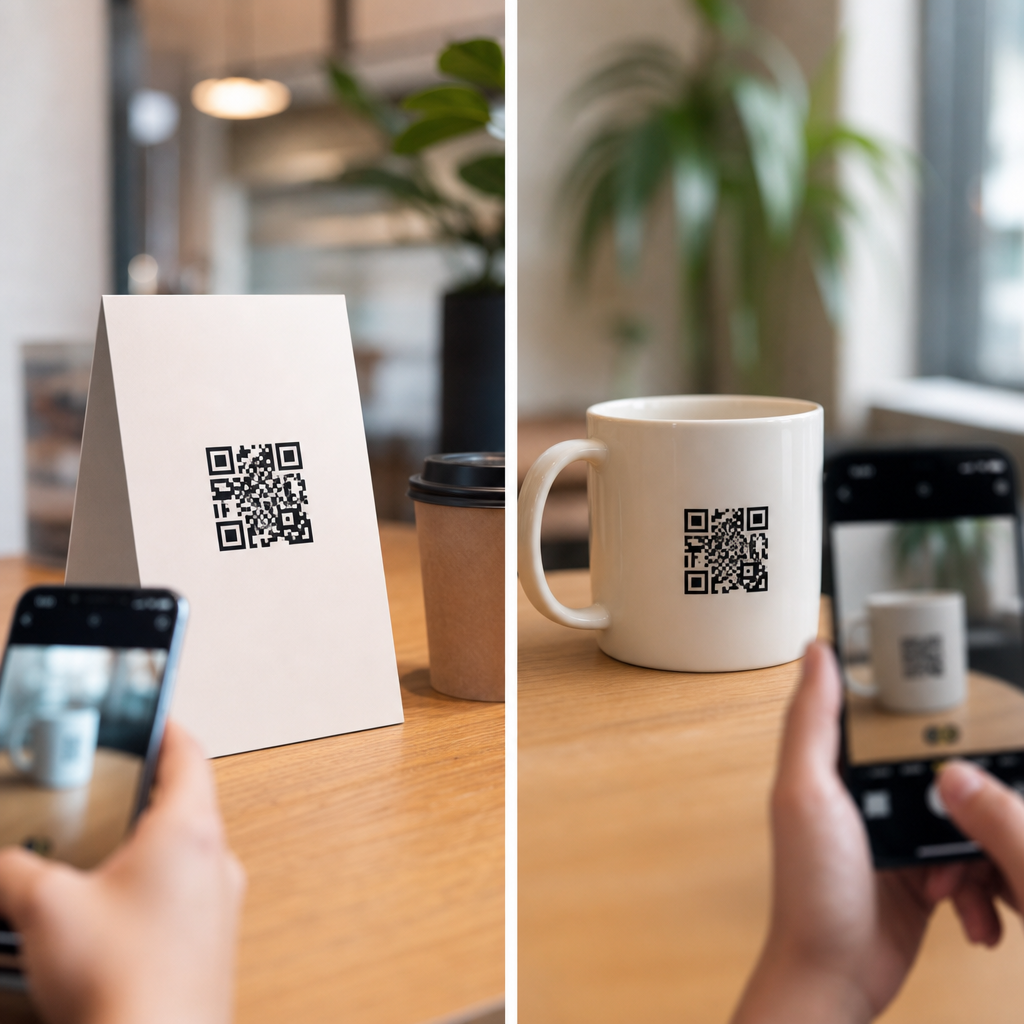
Consider a restaurant chain testing table tent QR codes. Version A says, “Scan to view menu.” Version B says, “Scan to order and skip the line.” Scans increase modestly with Version B, but completed orders rise far more because the CTA promises a faster outcome, not just access. The lesson is that intent-rich copy often outperforms informational copy when the post-scan experience is transaction-ready.
In consumer packaged goods, I worked on a packaging test where one variant placed the QR code near nutrition information and another placed it near a recipe image. The recipe-adjacent placement delivered fewer immediate scans in store but far more at-home repeat visits and higher coupon redemption because it aligned with use context. That is why QR code optimization should consider when and where scanning happens, not just whether the code is visible.
Another common win comes from landing page simplification. A B2B manufacturer sent trade show attendees to a full website in Version A and to a mobile page with one product video, three proof points, and a short lead form in Version B. Scan volume was similar, but lead completion doubled on the focused page. The test did not make the QR code more attractive; it removed friction after the scan. That distinction is crucial when diagnosing underperformance.
How to Build a Repeatable QR Code Testing Program
One-off tests help, but a repeatable program compounds gains. Create a testing backlog ranked by potential impact, confidence, and implementation effort. Record each hypothesis in a standard template: audience, variable, control, treatment, primary KPI, secondary metrics, sample requirement, launch date, and decision threshold. After each test, write a short readout explaining not only who won, but why the team believes that result occurred. Those notes become the operating memory of your QR strategy.
Governance matters as campaigns scale. Keep a registry of active QR codes, destinations, expiration dates, ownership, and analytics tags. Audit scan paths on multiple devices before every launch. Establish print production standards for contrast ratio, quiet zone, minimum size, and error correction level. Version control your landing pages so a developer update does not unknowingly contaminate a live experiment. Advanced QR Code Strategies work best when creative, analytics, web, and operations teams share one measurement plan.
The main benefit of A/B Testing QR Codes is predictability. Instead of guessing whether a new design, offer, or placement will work, you build evidence from real user behavior across physical and digital touchpoints. Start with a single high-impact variable, track the full funnel, and document what you learn. Then connect this hub to your deeper work on landing pages, dynamic QR code tracking, attribution, and scan-to-sale optimization. If you want stronger QR campaign performance, launch one disciplined test this month and let the data decide.
Frequently Asked Questions
What does A/B testing a QR code campaign actually involve?
A/B testing a QR code campaign means comparing two or more controlled variations to see which one drives better results. Instead of treating scans as the only success signal, you define a meaningful business outcome first, then measure how each version contributes to that goal. For example, one version might use a different call to action such as “Scan to save 20%” versus “Scan to see today’s offer.” Another test might compare code placement on packaging, direct mail, retail signage, or event booth displays. You can also test the landing page experience after the scan, including page design, copy, form length, product offers, or app install prompts.
The key is to change one major variable at a time whenever possible. If you alter the QR code design, the headline, and the landing page all at once, it becomes difficult to know what caused the performance difference. A strong A/B test gives similar audience segments different versions under similar conditions, then tracks outcomes such as total scans, unique scans, conversion rate, purchase rate, lead quality, store visits, or revenue per scan. In practical terms, A/B testing QR campaigns is about using real-world scan behavior to improve decisions, not guessing which creative or placement feels best.
What should I test first in a QR code campaign?
The best place to start is with the element most likely to influence user behavior. In many QR code campaigns, that is the call to action near the code, because people need a clear reason to scan. If your current placement simply shows a code with no context, testing new prompts can have an immediate impact. Phrases that emphasize value, urgency, convenience, or curiosity often perform differently depending on the audience and channel. For example, packaging might respond well to product education, while direct mail may perform better with a discount or limited-time offer.
After the call to action, placement is usually the next high-impact variable. A QR code near a product image, checkout area, shelf talker, or event registration desk may outperform the same code placed where visibility is lower or intent is weaker. Then look at the post-scan experience. Even if one version gets more scans, it may generate fewer conversions if the landing page is confusing, slow, or mismatched to the message that motivated the scan. In most campaigns, a practical testing order is: call to action, placement, landing page, incentive, and then visual treatment of the QR code itself. Starting with high-leverage elements helps you learn faster and improve performance without overcomplicating the test design.
Which metrics matter most when measuring QR code A/B test results?
The most important metrics depend on your campaign objective, which is why scans alone should never be the full story. If your goal is awareness, scan rate and unique scans may be useful leading indicators. If your goal is lead generation, then form completions, cost per lead, and lead quality are more meaningful. For ecommerce, you should pay close attention to add-to-cart rate, purchase conversion rate, average order value, and revenue per scan. If the campaign is driving app adoption, app installs and downstream activation are better indicators than raw scan volume. For in-store efforts, you may want to track store visits, coupon redemptions, or location-based conversions.
It is also important to separate top-of-funnel engagement from bottom-of-funnel outcomes. One QR variation may attract more scans because it promises something broad or curiosity-driven, but another may convert better because it sets more accurate expectations. That is why serious testing should connect scan data to what happens after the scan. Track unique versus repeat scans, device type, time of day, source location, bounce rate, form completion rate, and final conversion. When possible, tie QR scans into your analytics and CRM so you can evaluate not just quantity, but quality and revenue impact. The winning version is not always the one with the most scans; it is the one that best supports the business outcome you care about.
How long should a QR code A/B test run to produce reliable results?
A QR code A/B test should run long enough to collect a meaningful amount of data across normal audience behavior patterns. The exact duration depends on traffic volume, conversion rate, and the environment where the code appears. A high-traffic retail display may gather enough scans in a few days, while packaging or direct mail tests may need several weeks to account for slower response cycles. In event settings, timing is even more compressed, so you may need to plan testing around specific event hours, booth traffic peaks, or multiple event days to reduce bias.
As a rule, avoid ending a test too early just because one version looks better at first. Early performance differences often narrow as more data comes in. You also want to account for weekday versus weekend behavior, promotional timing, and audience differences across locations. If possible, estimate in advance how many scans or conversions you need before making a decision. Statistical significance matters, but practical significance matters too. A tiny lift that is technically significant may not justify changing print materials, packaging, or signage at scale. The most trustworthy test duration is one that captures enough volume, enough consistency, and enough real-world variation to support a confident rollout decision.
What are the most common mistakes to avoid when A/B testing QR codes?
The biggest mistake is testing without a clearly defined success metric. If you do not know whether the goal is more scans, more purchases, more qualified leads, or more store visits, you can end up choosing a “winner” that does not help the business. Another common problem is changing too many variables at once. If one version has a new CTA, new placement, new landing page, and a different incentive, you may see a performance difference but have no idea what caused it. That makes it much harder to apply the learning to future campaigns.
Other frequent mistakes include poor audience splitting, inconsistent placement conditions, and weak tracking setup. If one QR code version appears in a higher-traffic area or reaches a different customer segment, your comparison may be unfair. It is also common to overlook the mobile experience after the scan. Even a strong QR prompt will underperform if the landing page is slow, cluttered, or not aligned with the promise made before the scan. Teams also sometimes focus too heavily on QR code styling, such as color or shape, before optimizing message clarity and user intent. Finally, many campaigns fail to connect scan behavior to downstream analytics, which means they learn only who scanned, not who converted. The best way to avoid these issues is to start with a clear hypothesis, keep the test structure clean, ensure tracking is in place from scan to conversion, and evaluate results based on business impact rather than vanity metrics.