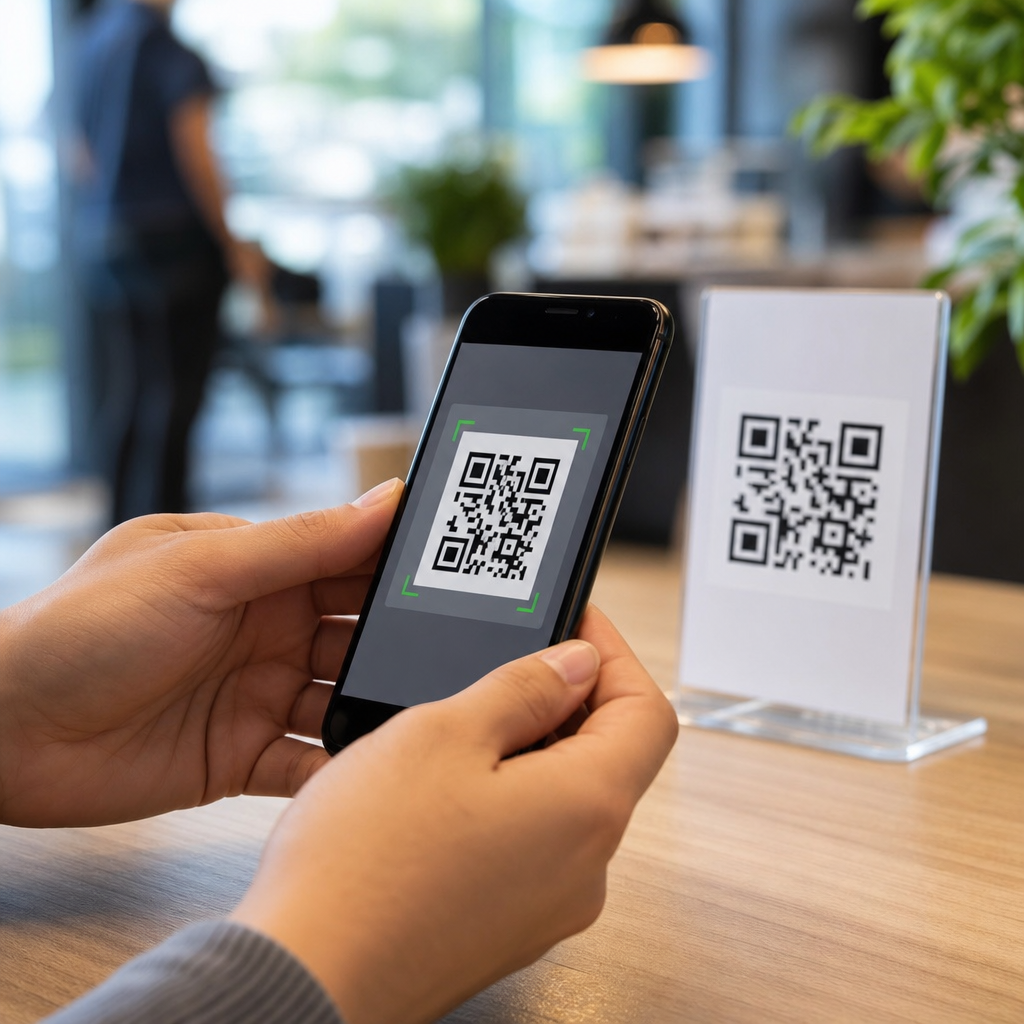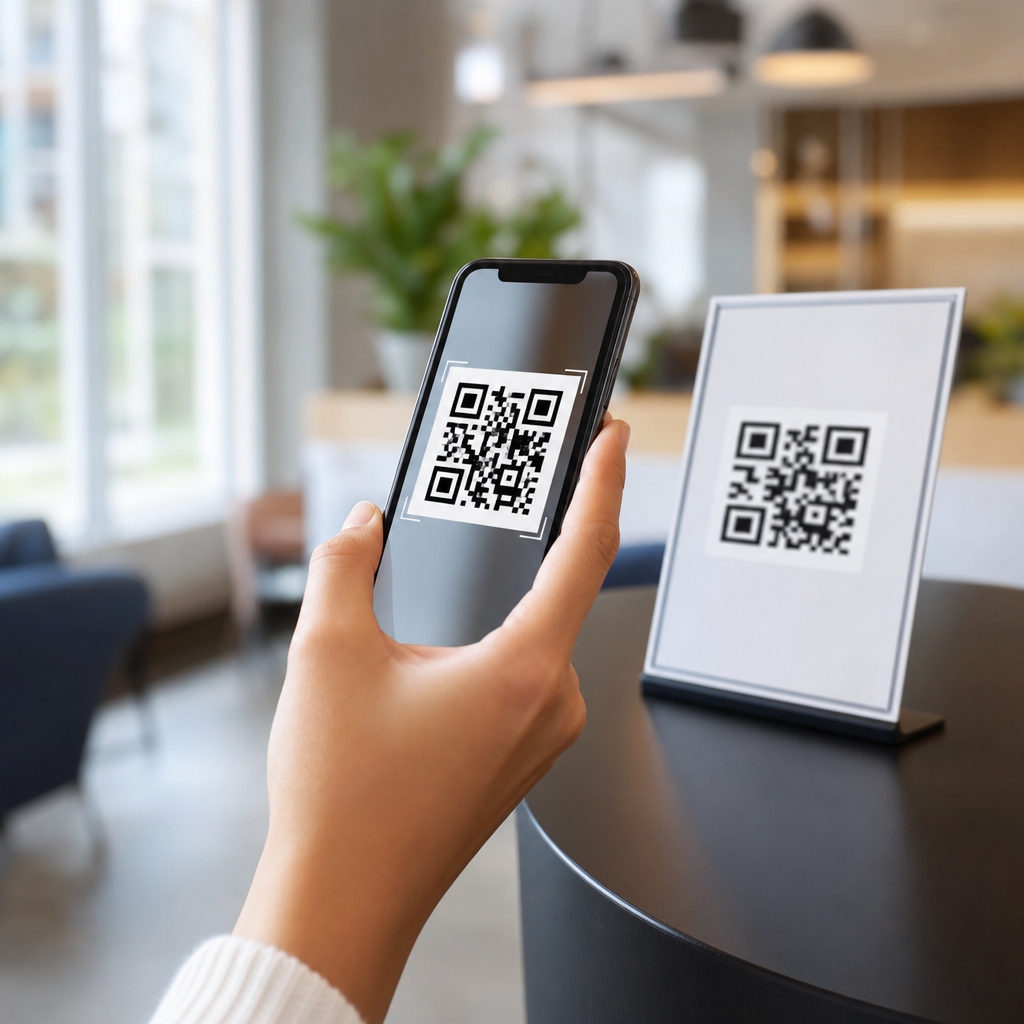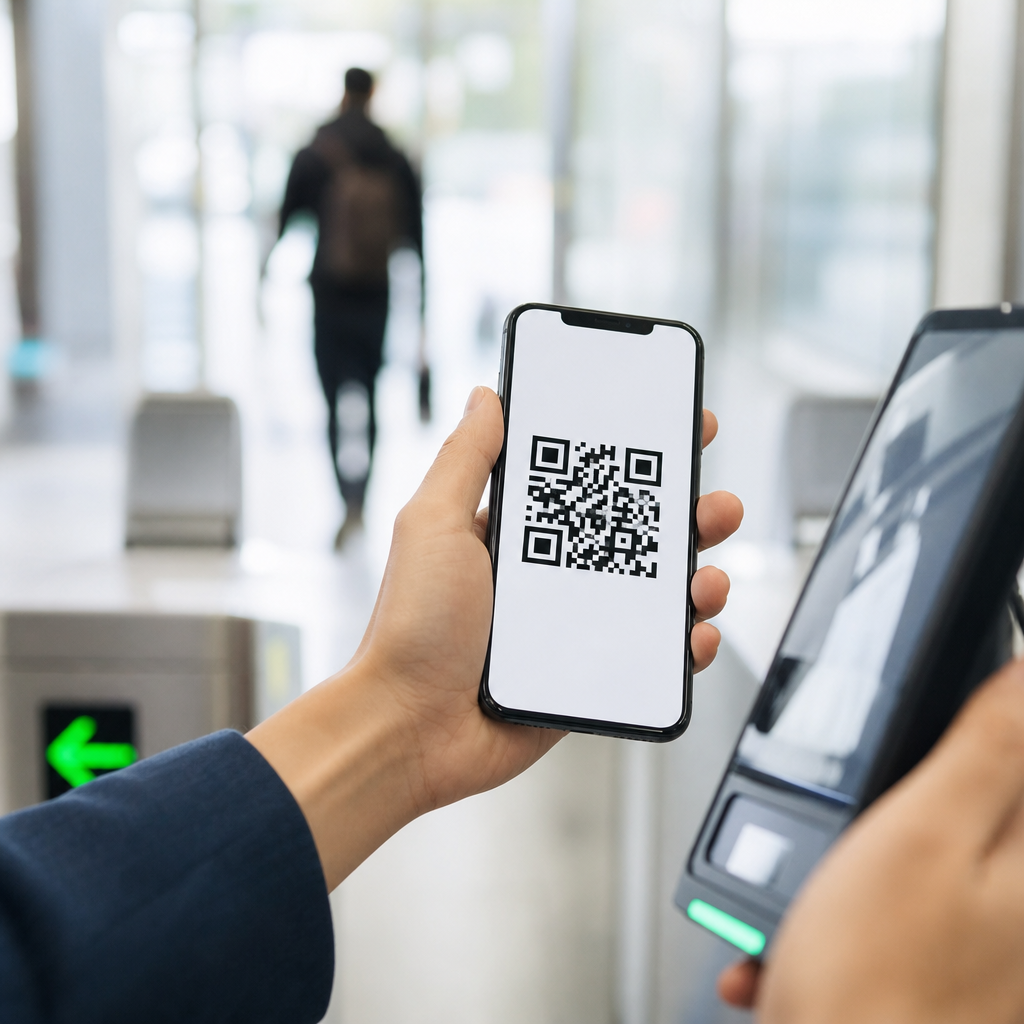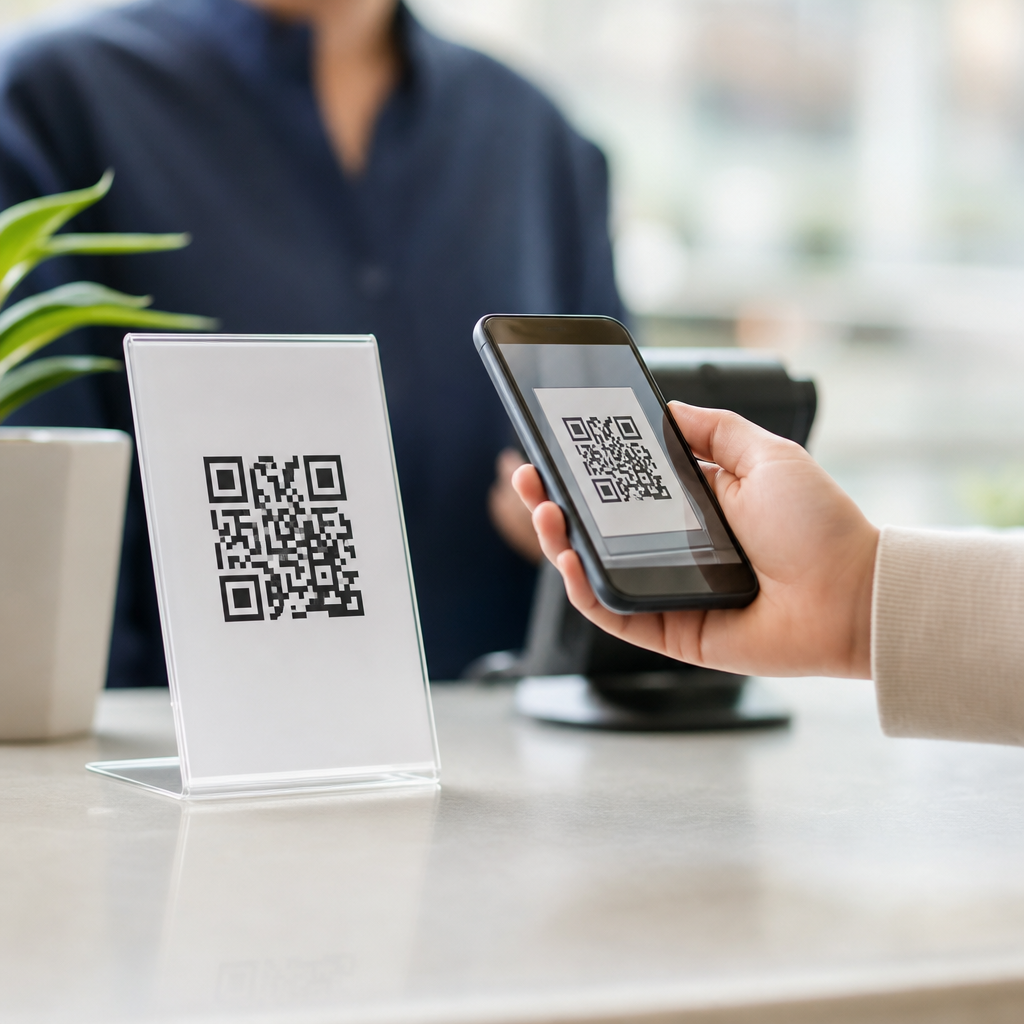
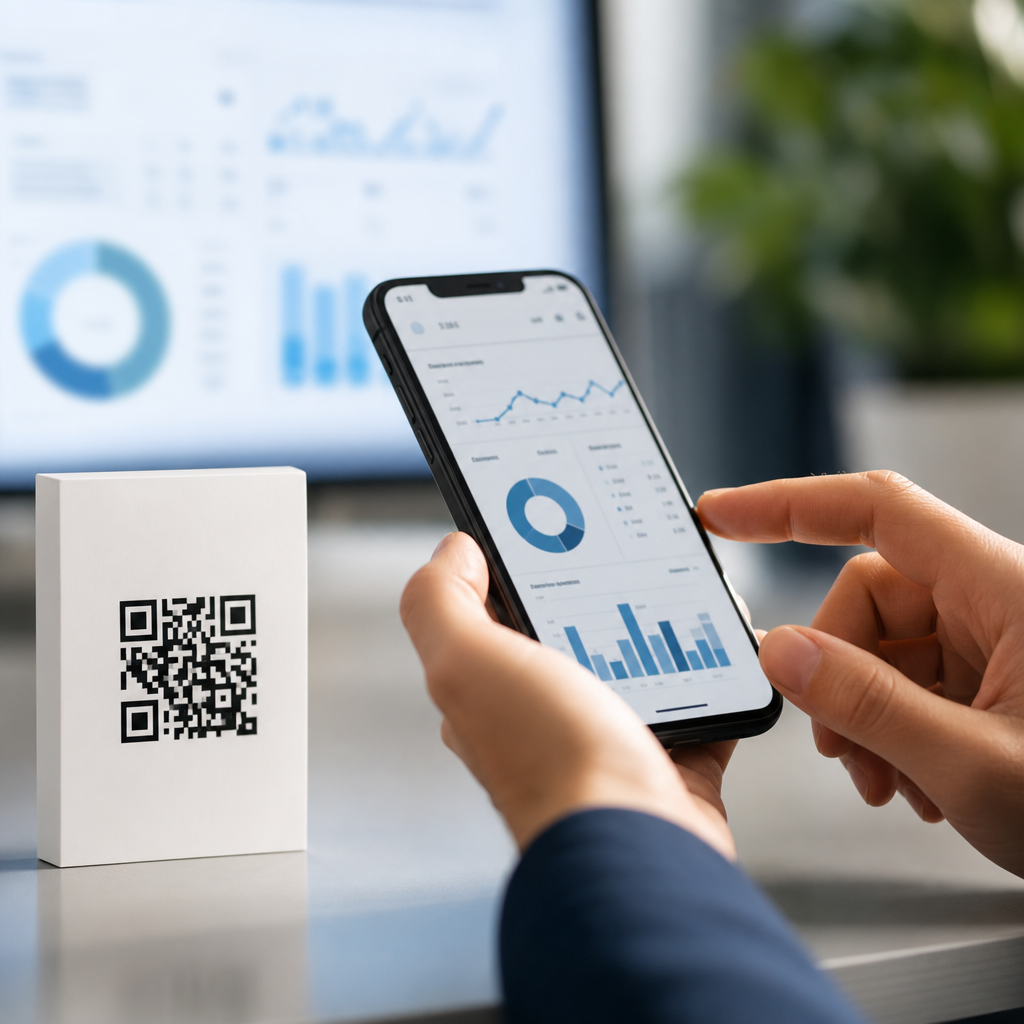
QR codes have evolved from simple scannable squares into measurable gateways between physical touchpoints and digital behavior, making real-time tracking and analytics one of their most valuable business benefits. A QR code, or Quick Response code, is a two-dimensional barcode that stores data such as a URL, contact card, payment link, file, or app action. When someone scans it with a smartphone camera, the code can open a destination instantly. The critical distinction for analytics is the difference between static and dynamic QR codes. Static codes point directly to fixed information and generally cannot be edited or measured after printing. Dynamic codes route scans through a managed short link, which allows destination updates, scan logging, campaign segmentation, and performance reporting.
I have used mobile QR codes across retail packaging, event signage, restaurant menus, field service documents, and direct mail campaigns, and the pattern is consistent: once teams can see scans by time, device, and location, QR codes stop being a novelty and become a decision tool. That matters because mobile traffic dominates many customer journeys, while offline marketing remains hard to measure without a digital bridge. QR tracking closes that gap. It helps a brand connect a poster, label, receipt, brochure, or storefront display to concrete user actions such as page visits, coupon claims, form completions, purchases, and support requests.
For a business building a Mobile QR Code Basics strategy, this topic sits at the center of the broader benefits of mobile QR codes. Real-time analytics improve campaign attribution, reveal customer intent, support faster optimization, and reduce wasted print spend. They also strengthen internal reporting because marketers, operators, and sales teams can compare locations, messages, and offers using the same measurement framework. In practical terms, a QR code is no longer just an access method. It is a trackable interaction point. Understanding how that interaction is captured, interpreted, and applied is essential for anyone choosing QR codes as a scalable mobile engagement channel.
What Real-Time QR Code Tracking Actually Measures
Real-time QR code tracking measures the events generated when a person scans a code and lands on the connected destination. In most platforms, the core metrics include total scans, unique scans, scan timestamp, approximate geolocation derived from IP address, device type, operating system, and browser. More advanced systems can also track referrer data, campaign parameters, conversions, and post-scan behavior when the landing page is connected to analytics tools such as Google Analytics 4, Adobe Analytics, HubSpot, or Meta Pixel.
The word real-time does not mean magical precision down to every human action. It means scan data appears quickly enough to guide active decisions, often within seconds or minutes. If a retailer places different QR codes on endcaps in ten stores, the marketing team can review scan volume during the promotion window and shift staffing, product placement, or local inventory before the campaign ends. If an event organizer notices one entry sign receives far fewer scans than another, that can indicate poor visibility, queue design issues, or unclear instructions.
Dynamic QR infrastructure is what makes this possible. The printed pattern stays the same, but the management platform logs the request before forwarding the user to the intended content. That redirect layer is where measurement happens. It also supports URL changes without reprinting, which is especially useful for packaging, out-of-home media, manuals, and permanent displays. In my experience, businesses often underestimate how valuable editability is until an offer expires, a page breaks, or a regional team needs a location-specific destination.
Why Mobile QR Codes Are Valuable for Attribution and Optimization
The biggest challenge with offline marketing has always been attribution. A flyer may drive sales, but proving it is difficult if the customer later types the homepage URL or searches the brand name. QR codes create a direct path from physical media to a tagged digital destination. When used with UTM parameters and a structured naming convention, they let teams attribute traffic and conversions to a specific asset, placement, date range, and audience segment.
Consider a restaurant chain testing three table tent offers: loyalty signup, limited-time dessert, and feedback survey. Each offer uses a separate dynamic QR code. By the end of the first weekend, scan rates show the dessert code gets more raw interest, but the loyalty code generates more registered users and repeat visits. That distinction matters. Volume alone is not the goal. The right analytics setup ties scans to business outcomes.
Optimization also becomes faster. Traditional print campaigns often require waiting until the end of a run to judge performance. With mobile QR codes, teams can monitor daily trends and make adjustments immediately. They can swap landing page headlines, shorten forms, localize content, or redirect underperforming codes to stronger pages. This is particularly effective in retail, hospitality, healthcare, education, and events, where customer behavior changes by location and time of day.
| Use Case | What the QR Code Tracks | Business Decision Enabled |
|---|---|---|
| Product packaging | Scans by region, device, and campaign | Adjust packaging messages or regional offers |
| Direct mail | Response rate by list segment | Refine audience targeting and creative |
| In-store signage | Scans by store and time of day | Improve placement, staffing, or promotions |
| Events | Session or booth engagement | Shift signage, demos, or follow-up priorities |
| Menus and ordering | Menu views and order conversions | Simplify navigation or highlight profitable items |
Key Analytics Data Points and How to Interpret Them
Not all QR metrics carry equal value. Total scans are useful for measuring attention, but unique scans better estimate audience reach. A code on product packaging may receive repeat scans from the same user checking instructions, while a museum placard may indicate deep engagement when scans repeat across exhibits. Interpretation depends on context. Good analysis starts by defining the intended action before the campaign launches.
Time-based data often reveals operational truths. If scans spike during commuter hours, a transit ad may be reaching the right audience. If a campus poster gets most scans late at night, the content may need to be more mobile-friendly and concise. Location data can expose where a campaign is actually working. In a franchise environment, comparing scan rates per store can uncover differences in staff compliance, sign placement, or local demand.
Device and operating system data are also practical. If most scans come from iPhones, teams should still test Android behavior because camera handling, browser defaults, and wallet integrations can vary. Landing page speed matters here. Google’s Core Web Vitals are relevant after the scan because a slow page increases bounce rates and wastes the opportunity created by the code. I have seen campaigns improve simply by reducing page weight, clarifying the call to action, and removing unnecessary pop-ups on mobile.
Conversion tracking is where QR analytics mature. A scan only proves interest. A completed purchase, submitted form, downloaded brochure, redeemed coupon, or booked appointment proves value. The best setups connect QR destinations to event-based analytics in GA4 or a CRM, so teams can compare scan-to-conversion rates across assets. That is the level at which QR codes influence budgeting and executive reporting.
Best Practices for Building Measurable QR Campaigns
Effective QR code analytics begin before design and printing. First, choose dynamic codes from a platform that supports scan logs, editable destinations, access controls, and exportable reports. Established providers usually offer custom domains, password protection, expiration settings, and API access. Custom domains are especially useful because they reinforce brand trust and improve governance across large organizations.
Second, define naming conventions. Every QR code should map to a campaign, channel, placement, asset version, geography, and date. Without that structure, reporting becomes messy fast. Third, create mobile-first landing pages that match the scan context. A code on a shelf talker should not send users to a generic homepage; it should land on the exact product, offer, or help page promised by the sign.
Fourth, test relentlessly. Scan from multiple devices, lighting conditions, and distances. Verify redirects, analytics events, page speed, and form completion. Follow ISO/IEC barcode quality guidance and maintain adequate contrast, quiet zone spacing, and print size. A beautifully branded code that scans poorly is a failed asset. Fifth, think about privacy and compliance. If scan data is tied to personal information, consent and disclosure requirements may apply under regulations such as GDPR or CCPA. Approximate location reporting is usually sufficient for campaign analysis, and it is less intrusive than collecting precise GPS data.
Finally, use the hub structure wisely. A benefits-focused page like this should connect readers to deeper topics such as dynamic versus static QR codes, QR code design best practices, menu QR codes, QR codes for payments, and QR code security. That internal path helps users move from basics to implementation with less friction and better intent alignment.
Common Limitations and How Smart Teams Address Them
QR analytics are powerful, but they are not perfect. Scan counts can be affected by bot traffic, link previews, weak connectivity, or users who scan without converting. Geolocation based on IP is approximate, not exact. Offline environments with poor mobile reception can depress performance even when interest is high. And if a destination page lacks proper analytics tagging, the team may know a scan happened but not what the visitor did next.
Smart teams reduce these issues through process. They filter suspicious traffic where possible, validate data against web analytics, and use holdout comparisons when measuring lift. They place codes where scanning is easy, add short instruction text, and provide a fallback short URL for accessibility. They also avoid using one code for too many objectives. A single code tied to multiple mixed messages usually muddies the data and weakens user intent.
The main benefit remains clear: mobile QR codes make physical experiences measurable and improvable in near real time. When paired with dynamic links, strong landing pages, and disciplined analytics, they turn posters, packaging, menus, mailers, and displays into accountable marketing and service channels. If you are building out your Mobile QR Code Basics content hub, start by auditing where customers already encounter printed touchpoints, then assign trackable QR codes to the moments where speed, convenience, and measurement matter most.
Frequently Asked Questions
How do QR codes enable real-time tracking and analytics?
QR codes enable real-time tracking when they are connected to a dynamic destination rather than embedding a fixed final URL directly in the code. In practice, a dynamic QR code routes the scan through a tracking platform first, which records scan activity before sending the user to the intended webpage, file, form, app page, or other digital experience. That simple redirect is what makes measurement possible. Businesses can see when a scan happened, how many scans were generated, what type of device was used, and often the approximate location tied to the scan event. Because this data is collected instantly, marketers and operations teams can monitor campaign performance as it happens instead of waiting for delayed reporting.
This real-time visibility turns QR codes into measurable bridges between offline touchpoints and online behavior. A code printed on packaging, signage, direct mail, receipts, event materials, or in-store displays can be tracked the moment someone interacts with it. That means a business can compare engagement across locations, campaigns, time periods, and customer segments with much greater precision. Instead of treating printed materials as unmeasurable brand exposure, organizations can use QR codes to understand exactly which physical assets are driving action and use those insights to optimize messaging, placement, and customer journeys in near real time.
What is the difference between static and dynamic QR codes for analytics?
The difference is critical. A static QR code contains the final destination information directly inside the code itself. For example, if the code stores a webpage URL, every scan sends the user straight to that address with no management layer in between. Static QR codes are useful for simple, permanent use cases, but they offer little to no built-in flexibility for tracking, editing, or optimization. Once created and printed, they generally cannot be updated without generating and redistributing a completely new code.
Dynamic QR codes, by contrast, are designed for analytics and campaign control. Instead of storing the final destination alone, they point to a short redirect URL managed through a QR platform. That platform logs the scan event, captures reporting data, and then forwards the user to the destination. Because the destination is controlled centrally, businesses can change where the code leads even after printing it. This makes dynamic QR codes ideal for marketing campaigns, product packaging, restaurant menus, event promotions, customer support flows, and any use case where measurement matters. If a company wants actionable analytics, A/B testing opportunities, scan reporting, and the ability to update content without reprinting, dynamic QR codes are the standard choice.
What types of data can businesses track from QR code scans?
The exact data available depends on the platform being used, but most business-grade QR code systems can track a strong set of engagement metrics. Common data points include total scans, unique scans, time and date of each scan, device type, operating system, browser, and approximate geographic location based on IP data. Many platforms also show scan trends over time, which helps identify peak engagement windows and regional performance differences. If the QR code is tied to a campaign, businesses may also segment results by asset, channel, or placement, such as comparing scans from packaging versus posters or one retail store versus another.
More advanced setups can go beyond scan-level data and connect QR interactions to broader analytics systems. For example, QR destinations can include UTM parameters so scans flow into web analytics platforms like Google Analytics, making it possible to track post-scan behavior such as page views, conversions, purchases, form submissions, downloads, or sign-ups. This creates a more complete attribution path from physical interaction to digital outcome. In many cases, the real value is not just knowing that a code was scanned, but understanding what happened after the scan and which touchpoints are generating the highest-quality engagement.
Why are QR code analytics valuable for marketing and business decision-making?
QR code analytics are valuable because they make offline engagement measurable in a way that was historically difficult. Traditional print materials, packaging, out-of-home advertising, and in-store signage often lacked direct performance data. With trackable QR codes, those physical assets become actionable sources of insight. Marketers can identify which creative formats, locations, offers, and calls to action are producing the strongest response. Sales teams can evaluate regional demand. Operations teams can monitor how customers access support resources, product instructions, or digital menus. Leadership can make better decisions because campaign performance is tied to real behavioral data rather than assumptions.
These insights also support faster optimization. If a campaign is underperforming in one market but generating strong scan rates in another, businesses can adapt messaging, offers, or placement quickly. If one QR code on product packaging consistently drives support article visits, that may signal customer confusion that needs to be addressed upstream. If event signage gets heavy scan activity during certain hours, staffing and promotions can be adjusted accordingly. In short, QR analytics do more than count interactions. They help organizations understand customer intent, improve user experiences, allocate budget more intelligently, and strengthen the connection between physical presence and digital conversion.
What are the best practices for using QR codes to get accurate and useful analytics?
To get meaningful analytics, businesses should start by using dynamic QR codes through a reliable platform that provides real-time reporting and destination management. Each QR code should have a clear purpose tied to a specific campaign, asset, audience, or conversion goal. It is also important to avoid reusing one generic code across too many unrelated contexts, because that makes results harder to interpret. Creating separate codes for different products, locations, ads, mailers, or displays gives cleaner data and makes comparison far more useful. Adding UTM parameters to destination URLs is another best practice, as it helps connect QR scan activity with downstream web analytics and conversion tracking.
Execution matters just as much as setup. QR codes should be placed where they are easy to notice and scan, paired with a clear call to action that tells users what they will get by scanning. Testing across devices, lighting conditions, print sizes, and surfaces is essential to reduce scan friction and protect data quality. Businesses should also review analytics regularly instead of treating QR reporting as a one-time check. Ongoing analysis helps identify trends, low-performing placements, and opportunities for improvement. Finally, organizations should be mindful of privacy and data governance, especially when integrating scans with larger customer data systems. When implemented thoughtfully, QR codes can deliver accurate, real-time insights that are both practical and strategically valuable.