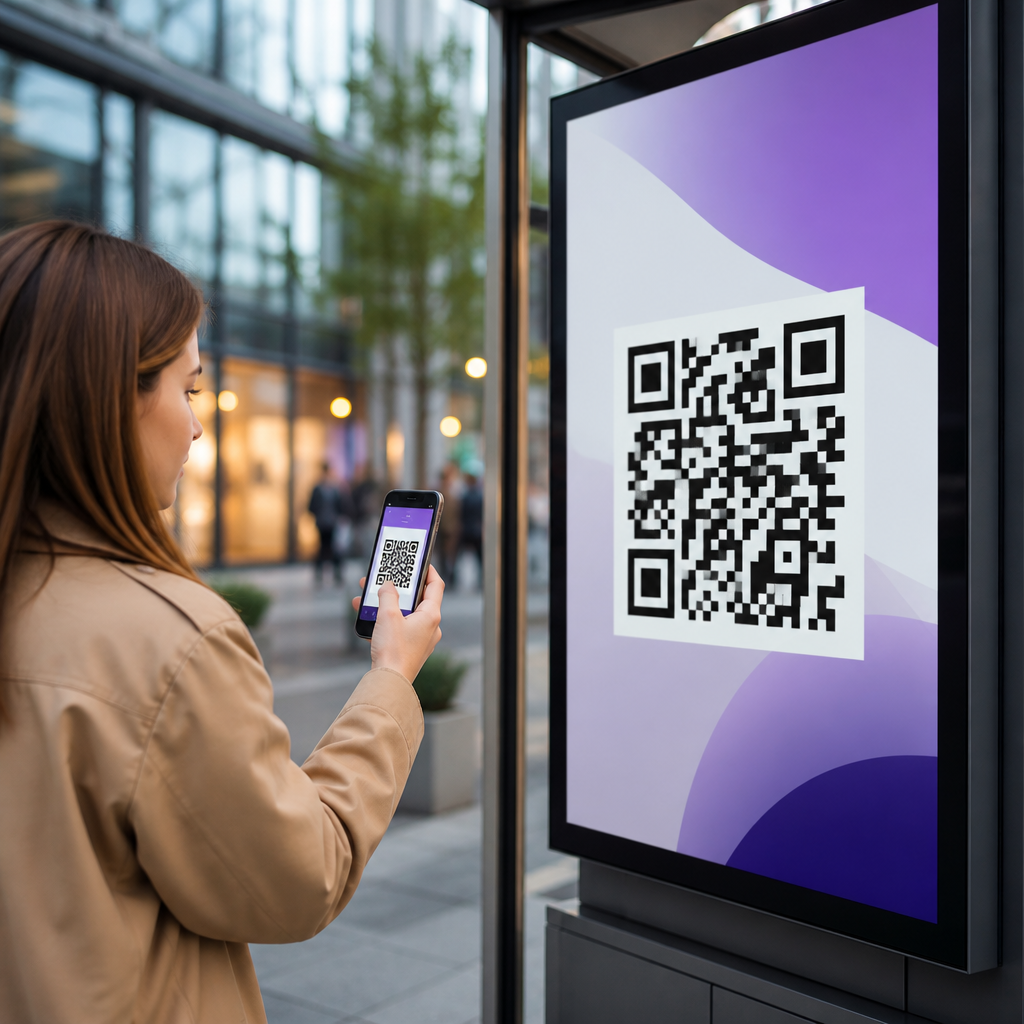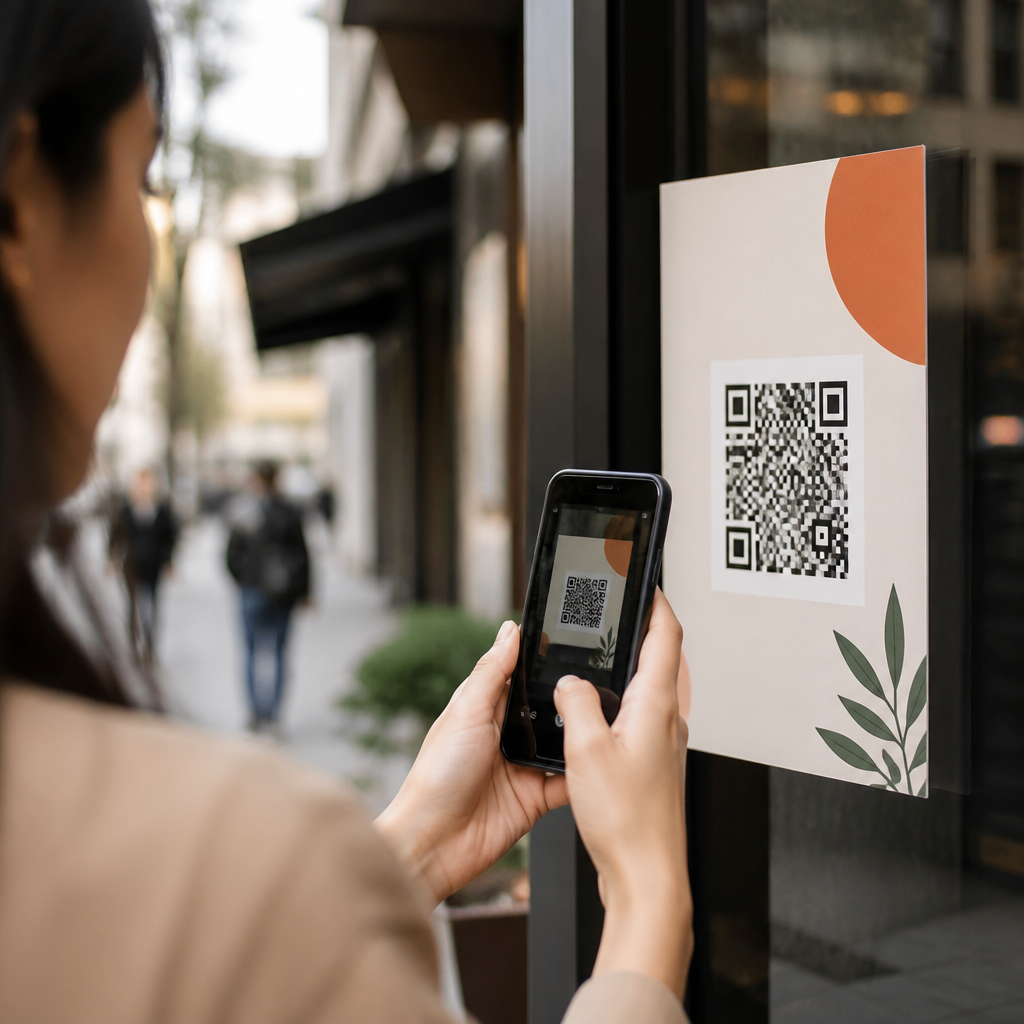
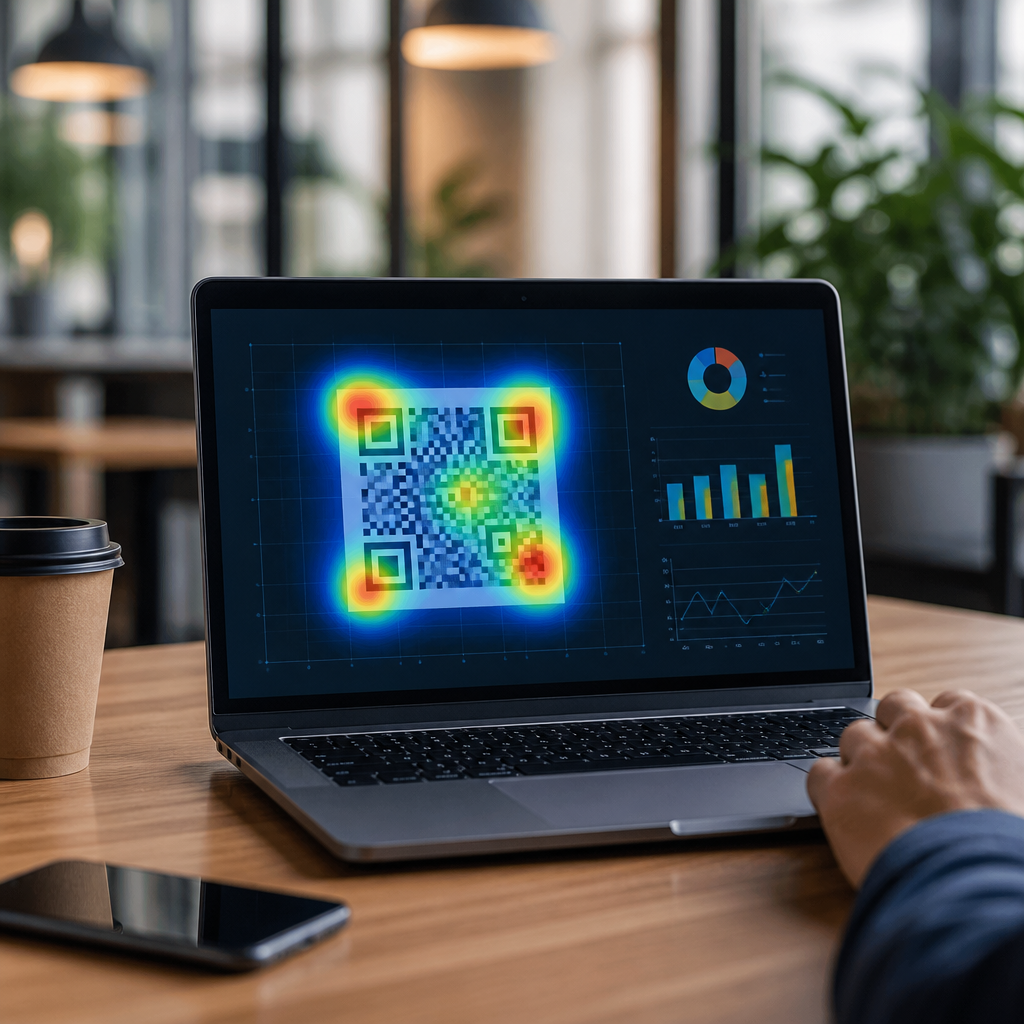
QR code heatmaps and user behavior insights turn a simple scan into measurable marketing intelligence. In the context of mobile QR codes for marketing, a heatmap is a visual layer that shows where scans happen most often, while user behavior insights explain what people do before and after scanning. Together, they help teams move beyond counting scans and start understanding intent, location, timing, device context, and conversion quality. I have used QR campaigns for retail launches, event check-ins, restaurant menus, and direct mail, and the same lesson appears every time: total scan volume is useful, but it rarely tells the full story.
QR code analytics and tracking matter because offline touchpoints are traditionally hard to measure with precision. A printed poster, product package, table tent, or storefront decal may generate awareness, but without a scannable link and a reporting layer, attribution stays vague. Dynamic QR codes change that. Because the destination URL can be managed after print and each scan can be logged, marketers can measure time of day, geography, repeat activity, operating system, referral parameters, and downstream actions in analytics platforms. Heatmaps add spatial understanding, making scan concentration patterns visible across regions, venues, store zones, or campaign placements.
For a sub-pillar hub under mobile QR codes for marketing, this topic connects every major reporting question. How do you track QR code performance? Which metrics actually indicate campaign success? What can location data reveal about customer behavior? How do you compare print placements, creative versions, or distribution channels? And where are the privacy and data quality limits? This guide answers those questions directly so teams can plan measurement before launch, optimize live campaigns, and connect QR engagement to real business outcomes such as leads, orders, bookings, app installs, or foot traffic.
What QR Code Analytics and Heatmaps Actually Measure
QR code analytics and tracking begin with the distinction between static and dynamic codes. Static QR codes point directly to a fixed destination and generally cannot be updated or measured beyond what the final website records. Dynamic QR codes route scans through a managed redirect, which makes tracking possible. In practice, that redirect can capture the scan timestamp, approximate geolocation derived from IP address, device type, operating system, browser, and campaign parameters before sending the user to the landing page. Platforms such as Bitly, QR Code Generator Pro, Beaconstac, Flowcode, and Uniqode commonly offer this reporting layer.
Heatmaps are the visual expression of that scan data. At the simplest level, a heatmap shows more intense color where scan activity is concentrated. For local campaigns, that may mean seeing which neighborhoods respond to a restaurant promotion. For retail, it can show whether in-store shelf talkers outperform window signage. For national direct mail, it can reveal regional variation in response rates. The key point is that heatmaps do not replace core metrics; they contextualize them. A city with high total scans may still underperform if conversion rate is weak, while a lower-volume area may deserve more budget because the scans there convert efficiently.
Good analytics also separate vanity metrics from decision metrics. Total scans, unique scans, repeat scans, scan-to-session rate, bounce rate, engaged sessions, conversion rate, revenue per scan, and cost per acquisition each answer different questions. In one campaign I managed for a franchise brand, poster scans looked strong until we segmented by location and device. Urban transit stations produced many accidental or low-intent scans, while neighborhood storefronts produced fewer scans but far more appointment bookings. Without segmentation and heatmap review, the team would have invested in the wrong placements.
Core Metrics That Reveal User Behavior
The best QR code user behavior insights come from combining scan data with website or app analytics. A scan is only the top of the funnel. Once a user lands on the destination, you want to know whether they stayed, clicked, submitted a form, redeemed an offer, or abandoned the page. In Google Analytics 4, this means mapping QR campaigns with UTM parameters and reviewing sessions, engagement time, event completions, and attributed conversions. In app campaigns, tools such as AppsFlyer or Branch can extend tracking from scan through install and in-app activity.
Several metrics consistently matter most. Unique scans show reach. Repeat scans can indicate strong interest, poor landing-page clarity, or practical reuse, such as menu access. Time-of-day trends reveal when users are most receptive. Device and operating system data help QA landing pages and explain performance differences, especially if a page loads slowly on older Android devices. Geographic distribution supports local optimization. Most important, conversion metrics tie QR exposure to outcomes the business values.
| Metric | What it shows | How to use it |
|---|---|---|
| Total scans | Overall activity volume | Measure campaign reach at a high level |
| Unique scans | Estimated distinct users | Compare true audience size across placements |
| Scan time | When people engage | Schedule staffing, ads, or offers around peak periods |
| Location data | Where scans happen | Build heatmaps and adjust distribution geographically |
| Device and OS | Technical user context | Improve page speed and mobile compatibility |
| Conversion rate | Business outcome efficiency | Prioritize placements that generate results, not just scans |
Behavior interpretation requires caution. A high bounce rate is not always negative if the landing page delivers a phone number, coupon code, or store hours immediately. Likewise, repeat scans from the same user may signal loyalty rather than friction. The right reading depends on campaign purpose. A package QR code for assembly instructions should encourage repeated use. A lead-generation QR code on a trade show banner should move users quickly to form completion. Context turns raw metrics into reliable insight.
How Heatmaps Improve Campaign Decisions
Heatmaps make optimization easier because they compress complex location data into a pattern people can act on quickly. If a multi-store retailer sees dense scan activity near entrances but weak activity in checkout lanes, it may mean the call to action is stronger at the point of arrival than at purchase. If a city tourism campaign sees clusters around train stations but minimal scans at museums, the issue may be sign visibility, language mismatch, or weak creative. In field testing, I have often used heatmaps not as final evidence but as a diagnostic starting point that prompts store visits, creative audits, and staff interviews.
Placement testing is one of the strongest uses. Suppose a restaurant group adds QR codes to window decals, table tents, takeout packaging, and loyalty flyers. Total scans alone can rank channels, but heatmaps and user behavior data can reveal something more useful: packaging may generate scans from a wider geographic area because customers carry it home, while table tents may generate faster same-session conversions for dessert upsells or loyalty registration. That distinction affects both creative strategy and budget allocation.
Heatmaps also support operational decisions. Event organizers can use scan density by gate or zone to reduce bottlenecks and improve signage. Real estate marketers can compare scans from yard signs, print brochures, and open-house materials by neighborhood. Consumer packaged goods brands can monitor scan intensity around retail partners to identify where shelf displays are actually driving engagement. When heatmaps are layered with sales or footfall data, they become especially powerful because they connect interest signals to commercial impact.
Implementation Best Practices for Accurate QR Tracking
Reliable QR code analytics depend on setup quality. Start with dynamic QR codes, consistent naming conventions, and structured UTM tagging. I recommend defining campaign, source, medium, content, and location values before anything goes to print. If one flyer uses “spring-sale” and another uses “SpringSale,” reporting becomes messy fast. Standardized parameters make hub-level analysis possible across all QR code analytics and tracking articles, campaigns, and channels.
Landing-page design matters just as much as tagging. Pages must load quickly, match the promise of the QR call to action, and remove unnecessary steps. Mobile-first design is mandatory because scans happen on phones. Use server-side redirects when possible, validate analytics events in GA4 DebugView or Tag Assistant, and test every code on iOS and Android before launch. For larger programs, dashboards in Looker Studio, Tableau, or Power BI can combine QR platform data with web analytics and CRM outcomes.
Privacy and data limitations should be understood upfront. Location from IP address is approximate, not GPS-precise. Apple and browser privacy features can limit attribution detail. Duplicate scans may be inflated by bot traffic, accidental rescans, or employee testing if exclusions are not configured. In regulated sectors, consent and data retention rules may apply, especially when QR scans lead to forms collecting personal information. Accurate reporting is not just about collecting more data; it is about collecting defensible data and documenting how it was generated.
Using This Hub to Build a Smarter QR Measurement Program
This hub page on QR code analytics and tracking is the foundation for every deeper topic in the sub-pillar. From here, marketers can branch into scan tracking setup, dynamic versus static QR code measurement, UTM strategy, dashboard reporting, conversion attribution, offline-to-online campaign analysis, A/B testing of QR placements, and privacy-safe measurement practices. The hub matters because no single metric explains performance. Effective QR marketing depends on linking heatmaps, user behavior, technical quality, and business outcomes in one reporting framework.
The central takeaway is simple: QR code heatmaps and user behavior insights make offline marketing measurable and improvable. They show where engagement starts, which audiences respond, what devices they use, and whether scans lead to meaningful actions. When you combine dynamic QR codes, disciplined tagging, mobile-optimized landing pages, and conversion reporting, QR campaigns become accountable channels rather than black boxes. Review your current QR placements, audit your tracking setup, and build a reporting dashboard that turns every scan into a decision.
Frequently Asked Questions
What is a QR code heatmap, and how is it different from basic scan tracking?
A QR code heatmap is a visual reporting layer that shows where scans are concentrated across locations, regions, venues, or specific placement zones. Instead of only telling you how many times a QR code was scanned, it helps you see where engagement is strongest and where it is weak. Basic scan tracking usually reports totals such as number of scans, time of scan, and sometimes device type. A heatmap adds spatial context, which is what turns raw activity into something a marketing team can act on.
For example, if a retail campaign places the same dynamic QR code on window displays, shelf talkers, checkout signage, and in-store posters, a heatmap can reveal which placement actually drives the most scans. That matters because high visibility does not always mean high engagement. A code near the entrance may get attention, but a code near a product demo station may attract more motivated shoppers. Heatmaps help separate casual interest from action-oriented behavior.
This becomes even more valuable when heatmaps are paired with user behavior insights. Once someone scans, you can evaluate what happened next, such as whether they stayed on the landing page, clicked a product link, redeemed an offer, registered for an event, or dropped off immediately. In other words, the heatmap shows where intent starts, while behavior analytics help explain whether that intent turned into meaningful results. That combination gives marketers a much clearer picture than scan counts alone ever could.
What kinds of user behavior insights can marketers learn after someone scans a QR code?
After a scan, marketers can learn a wide range of behavior signals that help measure campaign quality, not just campaign activity. Common insights include landing page views, time on page, bounce rate, button clicks, form completions, coupon redemptions, purchases, app downloads, video plays, and repeat visits. Depending on the setup, teams may also see referral context, operating system, device type, browser, time of day, and approximate location. These signals help answer a more important question than “Did someone scan?” which is “What did that person do next?”
Behavior insights are especially useful for understanding intent. A high scan count might look successful at first glance, but if most visitors leave within a few seconds, the campaign may be generating curiosity rather than conversion. On the other hand, a smaller number of scans that produce strong engagement and completed actions may indicate a more qualified audience. This is why conversion quality matters. The goal is not always maximum volume. Often, the better outcome is attracting the right people and guiding them into the right next step.
Marketers can also compare behavior by campaign segment. For instance, scans from an event booth might produce longer sessions and higher sign-up rates than scans from street posters. In retail, packaging scans may lead to product education, while endcap display scans may lead directly to purchases or offer redemptions. Those patterns help teams refine creative, placement, audience targeting, and landing page design. Over time, user behavior insights make QR campaigns less experimental and more performance-driven.
How do QR code heatmaps help improve marketing campaigns in retail, events, and local promotions?
QR code heatmaps help improve campaigns by showing exactly where engagement is happening, which allows marketers to optimize placement, messaging, timing, and budget allocation. In retail, this may mean discovering that a code on product packaging performs better than one on aisle signage, or that certain store zones generate more scans because they catch customers closer to a purchase decision. Instead of making assumptions about foot traffic and visibility, teams can use scan concentration data to improve the physical customer journey.
At events, heatmaps can reveal which booths, entrances, sponsor displays, or session areas generate the strongest response. That information helps organizers and exhibitors understand attendee flow and interest. If one QR placement drives heavy scanning but poor follow-through, the problem may be the landing experience rather than the location. If another area drives fewer scans but much higher form completions, it may represent a more valuable engagement zone. That insight can influence booth design, signage strategy, staffing, and sponsorship pricing for future events.
For local promotions, heatmaps are useful for comparing neighborhoods, store clusters, transit stops, or out-of-home placements. A restaurant chain, for example, may learn that QR scans spike near office districts during lunch hours but perform better in residential areas during weekends. That level of insight helps shape both media planning and offer design. Rather than treating QR as a static tool, marketers can use heatmaps to run iterative campaigns, test placements, identify high-intent locations, and focus efforts where conversion potential is strongest.
What metrics matter most when evaluating QR code heatmaps and post-scan user behavior?
The most important metrics depend on campaign goals, but strong evaluation usually starts with a combination of scan volume, scan location, scan timing, unique versus repeat scans, device context, and conversion behavior. Scan volume tells you reach. Heatmap density tells you where interest is concentrated. Timing tells you when engagement happens, which can uncover patterns tied to store hours, commuting behavior, event schedules, or promotional windows. Unique versus repeat scans help distinguish broad audience reach from repeat interaction by the same users.
After the scan, the key metrics typically shift toward quality and outcomes. These include landing page engagement, click-through rate, form completion rate, coupon redemption rate, cart activity, purchases, sign-ups, and assisted conversions. Bounce rate and time on page are also helpful because they indicate whether the destination experience is aligned with user expectations. If a QR code promises a product demo but sends users to a generic homepage, engagement often drops. Good post-scan metrics can quickly expose that disconnect.
It is also important to connect QR performance to business objectives. For awareness campaigns, geographic scan concentration and engagement duration may be enough to judge success. For lead generation, form completion rate and lead quality matter more. For commerce, revenue per scan or conversion rate may be the most useful measures. The best analysis does not isolate one metric. It looks at the full path from where the scan happened, to what kind of device and context was involved, to what action the user completed afterward. That is how teams move from surface-level reporting to real marketing intelligence.
Are there privacy or data accuracy concerns with QR code heatmaps and user behavior insights?
Yes, and both privacy and accuracy should be taken seriously. Heatmaps and user behavior reports are powerful, but they are only valuable when implemented responsibly. On the privacy side, marketers should be transparent about what data is collected after a scan, especially if the landing page uses analytics tools, cookies, forms, retargeting pixels, or CRM integrations. Depending on the region and the nature of the data being gathered, compliance with privacy regulations such as GDPR, CCPA, or other local standards may be required. Clear consent practices and straightforward privacy disclosures are important parts of any QR-driven experience.
Accuracy also has limits. QR heatmaps often rely on approximate location data rather than precise GPS-level tracking, particularly when scans are inferred through IP-based methods or generalized mobile signals. That means the map is excellent for trend analysis, hotspot identification, and campaign comparison, but it should not be treated as exact forensic positioning. The same is true for device and attribution data. A user may scan on one device and convert later on another, which can make direct attribution incomplete unless the campaign is designed to track cross-session behavior.
The best practice is to treat QR heatmaps and behavior analytics as directional intelligence supported by sound campaign design. Use dynamic QR codes, tagged URLs, analytics integrations, consistent landing page structure, and clean conversion tracking. Compare heatmap findings with on-site observations, sales data, event attendance, or store performance where possible. When teams combine privacy-conscious data collection with realistic interpretation, QR insights become both trustworthy and strategically useful.