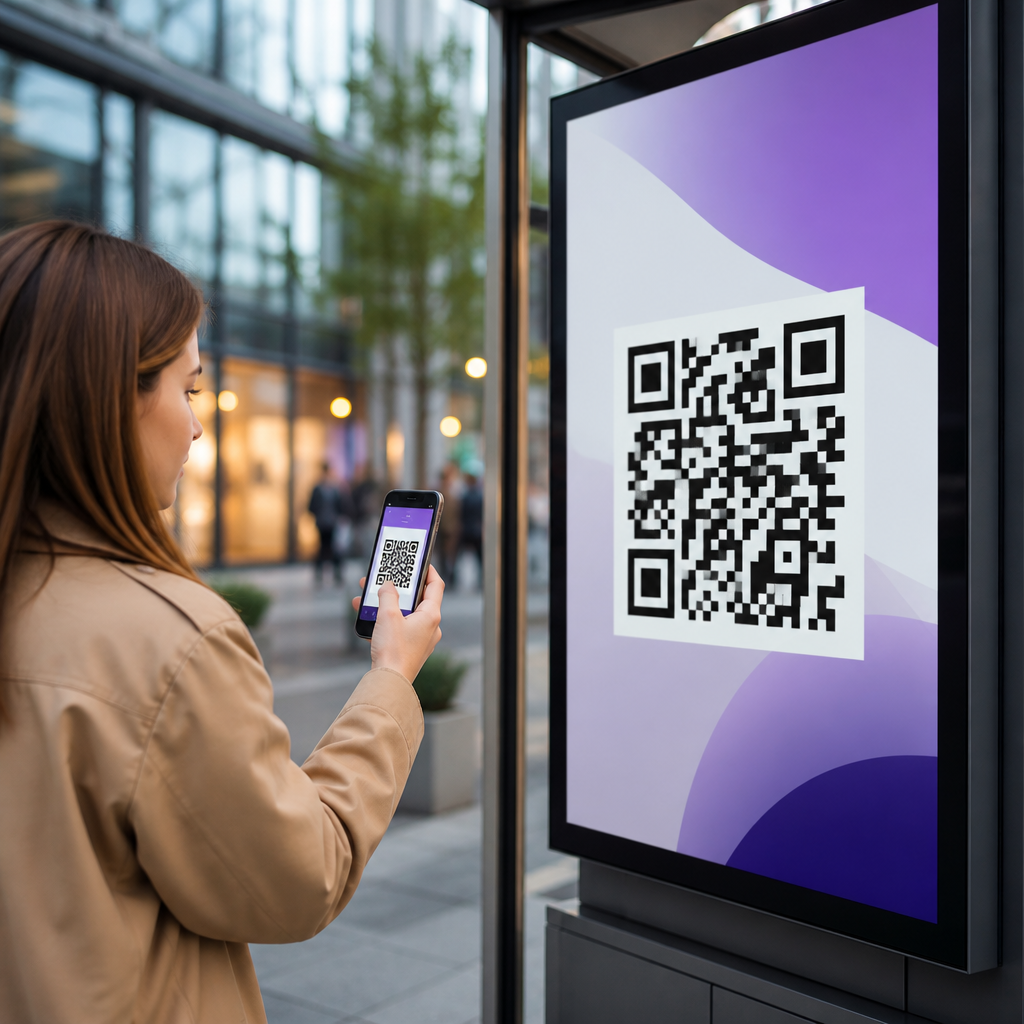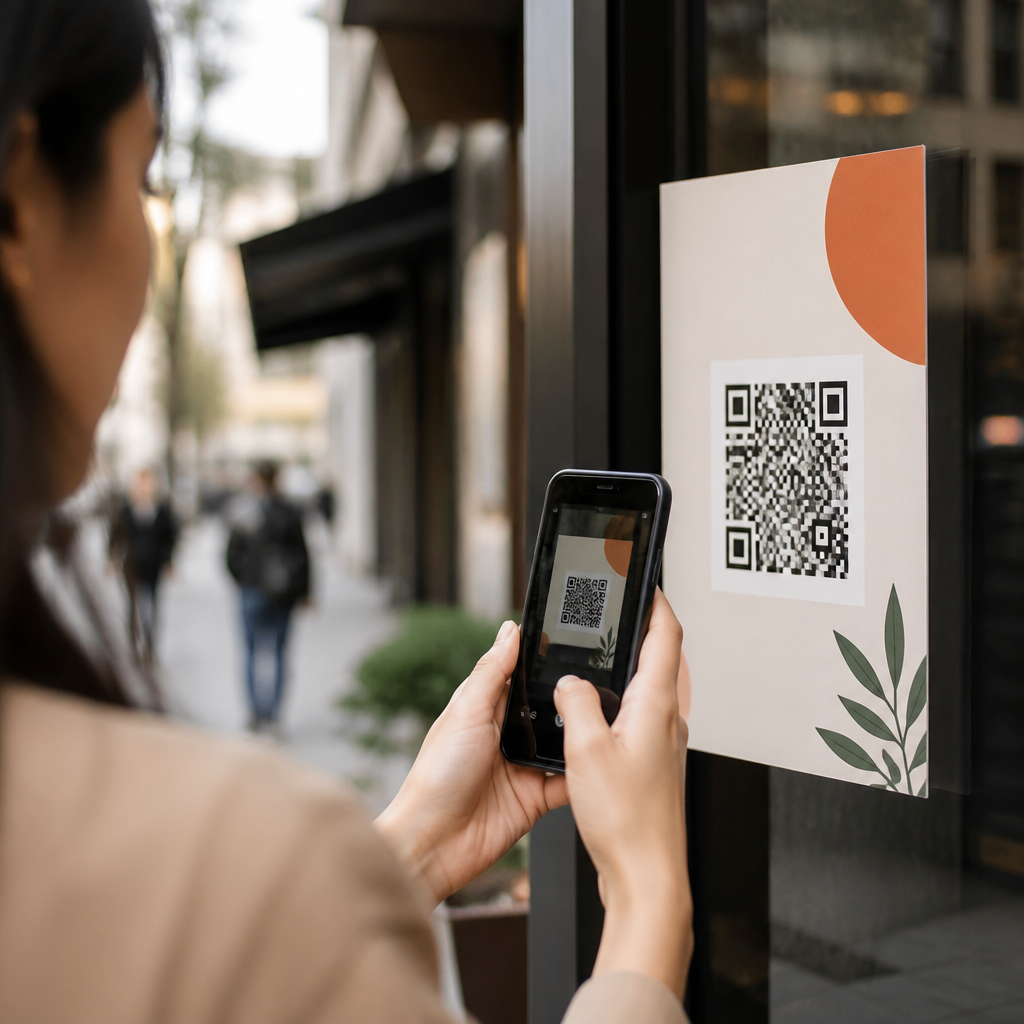

Measuring social media traffic from QR codes starts with a simple premise: every scan should lead to a trackable visit, and every visit should be tied back to the campaign, channel, and creative that caused it. In practice, that means combining dynamic QR codes, tagged URLs, web analytics, and platform reporting so you can see not just scans, but sessions, engagement, conversions, and revenue. For marketers building a mobile-first acquisition strategy, this matters because QR codes often bridge offline attention and online action faster than any short URL or manually typed link.
Within the broader world of mobile QR codes for marketing, QR codes for social media deserve their own measurement framework. A social QR code can send people to an Instagram profile, a TikTok landing page, a YouTube video, a Link-in-Bio hub, a social contest, or a product page promoted on social. Social media traffic, in this context, means website or app visits that originated from users scanning a QR code tied to a social objective. The key terms are straightforward. A static QR code contains a fixed destination that cannot be changed after printing. A dynamic QR code uses a short redirect, allowing edits, scan logs, and campaign controls. UTM parameters are query-string tags, such as utm_source or utm_campaign, that analytics tools use to classify traffic.
I have implemented QR tracking for retail signage, event booths, restaurant tabletop promos, and direct mail pieces linked to Instagram giveaways and creator campaigns. The repeated lesson is that scan count alone is not a reliable success metric. A poster in a train station may generate thousands of scans but little qualified traffic if the landing page is slow or mismatched. A smaller campaign, like QR cards handed out after a live demo, can produce fewer scans but much higher conversion rates. Proper measurement helps you separate curiosity from intent and identify which placements, offers, and social destinations actually move users deeper into the funnel.
Build a Measurement Stack That Connects Scans to Sessions
The cleanest way to measure social media traffic from QR codes is to map the path from scan to business outcome. A user scans the code with a phone camera. The code resolves through a dynamic QR platform such as Bitly, QR Code Generator PRO, Flowcode, Beaconstac, or Uniqode. That redirect sends the user to a URL containing UTM parameters. Your analytics platform, usually Google Analytics 4, Adobe Analytics, or Matomo, records the session source, campaign, landing page, and downstream events. If you also run a CRM or commerce platform, such as HubSpot, Salesforce, Shopify, or WooCommerce, you can extend attribution to leads, purchases, and customer value.
Use a consistent UTM taxonomy. For example, set utm_source=qr, utm_medium=offline, and utm_campaign=spring_social_launch. Then use utm_content to identify the exact creative or placement, such as instagram_poster_storefront, tiktok_flyer_event, or creator_card_packin. Some teams prefer utm_source values like instagram_qr or tiktok_qr. That can work, but I have found a normalized source for all QR traffic plus granular content naming makes reporting easier across many campaigns. Whatever convention you choose, document it and keep it stable, because inconsistent tagging is the fastest way to lose trust in the data.
Measurement also depends on destination design. If your QR code points directly to a native social profile, platform analytics may show profile visits or follows, but your website analytics will not capture a session unless the user later clicks through. If your goal is website traffic from QR codes, route scans first to a trackable landing page that reflects the social promise, then present clear paths to Instagram, TikTok, YouTube, or sign-up actions. This extra step gives you complete session data, supports remarketing, and creates a reliable bridge between offline media and social intent.
Choose the Right QR Code Strategy for Social Campaigns
Not every social campaign should use the same QR setup. For an evergreen “follow us” prompt in a store, a dynamic QR code pointing to a mobile landing page with icons for each network is usually best. For a time-bound creator activation, use a dedicated dynamic code for each creator, asset, or venue. For printed packaging tied to user-generated content, create separate codes by product line or region so you can compare scan behavior at a meaningful level. Granularity matters because aggregated QR reporting hides patterns you need for optimization.
A practical rule is one measurable objective per code. If a code on a table tent asks users to follow Instagram, watch a Reel, and claim a coupon, attribution gets muddy. If the purpose is social growth, send users to a page built around that action. If the purpose is commerce, send them to the product page and let social be a supporting proof point. I have seen scan-through rates improve when the QR call to action states exactly what happens next: “Scan to watch the demo on TikTok” consistently outperforms generic language like “Scan here.” Specificity reduces hesitation and sets a clear expectation for the visitor.
| Campaign type | Best QR destination | Primary KPI | Useful secondary KPI |
|---|---|---|---|
| In-store social follow push | Mobile landing page with social links | Sessions to landing page | Outbound clicks to profile |
| Creator collaboration | Dedicated campaign page | Qualified sessions by creator | Email sign-ups or sales |
| Event booth activation | Contest or lead form page | Conversion rate | Social shares |
| Packaging QR for community content | UGC gallery or hashtag page | Repeat scans or returning users | Time on page |
Dynamic codes are the standard choice because they support edits without reprinting. That matters when social platforms change URLs, campaigns expire, or you need to swap destinations by geography. Static codes still have a place for permanent information, but for social media measurement they are limiting. You lose redirect-level analytics and post-print flexibility. In most professional campaigns, the slight extra cost of dynamic infrastructure is justified by better attribution and less operational risk.
Track the Metrics That Actually Show Performance
The first metric is scans, but scans are only the top of the funnel. Good QR platforms report total scans, unique scans, scan time, approximate location, device type, and operating system. These are useful for diagnosing reach and accessibility. If scans spike at a particular venue but sessions remain low in analytics, the redirect may be slow, the page may fail to load on mobile, or users may abandon after seeing an unexpected destination. Compare QR platform logs with analytics sessions daily during active campaigns, because mismatches often reveal implementation problems quickly.
The second metric is engaged sessions. In GA4, pay attention to sessions, engagement rate, average engagement time, and key events such as scroll depth, video starts, add-to-cart, form submit, or outbound social clicks. For social QR campaigns, I usually define a custom event for clicks to each network button on the landing page, plus events for code redemption and sign-up completion. That structure lets you answer practical questions: Did the QR drive traffic? Did visitors choose Instagram or TikTok? Did they convert after interacting with social elements? Without event design, you only know they arrived, not what they did.
The third metric is conversion quality. If the QR code supports lead generation, tie visits to CRM records using hidden fields that capture UTMs on forms. If it supports sales, review assisted conversions, revenue per session, and new customer rate. For awareness campaigns, look at follower growth during the campaign window, but do not assign all follower lift to the QR unless you have isolated test conditions. Social performance is influenced by algorithmic distribution, paid boosts, and creator posts running at the same time. Balanced attribution produces better decisions than optimistic attribution.
Use Testing and Segmentation to Improve Results
Reliable measurement becomes valuable when you use it to optimize. Segment QR traffic by placement, audience, and creative. A code on packaging reaches existing customers. A code on an out-of-home poster reaches colder prospects. A code shown in a livestream reaches highly motivated viewers. Those groups behave differently, so compare them separately. In one campaign I managed for a beverage brand, can-packaging QR scans produced fewer sessions than event signage, but packaging visitors were twice as likely to join the loyalty list because they were already product users. Aggregated reporting would have hidden that insight.
A/B testing is possible even in print-heavy environments. Create two codes with identical destinations but different calls to action, colors, or placement. For example, “Scan to see our latest Reels” can be tested against “Scan for a behind-the-scenes video and coupon.” Keep the landing experience the same so the variable is the invitation, not the destination. You can also test landing pages: one focused on a single social channel versus one with multiple choices. The winning version is usually the one that minimizes decision friction while matching user intent from the physical context.
Segmentation by time and location is equally useful. Event campaigns often show predictable peaks right after a product demo, keynote mention, or creator appearance. Retail campaigns may perform better during weekends when shoppers have more time to engage. Location data from QR platforms is not as precise as GPS-grade analytics, but regional trends can still guide distribution and store-level creative choices. When you see one market overperforming, inspect the local execution before assuming audience differences alone explain the lift.
Avoid Common Attribution Mistakes and Reporting Gaps
The most common mistake is using the same QR code everywhere. If one code appears on window clings, receipts, packaging, and direct mail, you cannot tell which touchpoint drove the visit. The second mistake is skipping UTMs because the QR platform already reports scans. Scans do not replace analytics classification. You need both layers: redirect data for scan behavior and analytics data for on-site behavior. The third mistake is sending users to a generic homepage. Homepages dilute intent, complicate attribution, and usually underperform dedicated mobile pages.
Other gaps are more technical. iOS and Android may handle app deep links differently. Some in-app browsers suppress referral details. Consent banners can affect session tracking in regulated regions. Redirect chains can slow load time and reduce completion rates. Test every QR path on multiple devices, on cellular as well as Wi-Fi, and with analytics debug tools enabled. In GA4, validate that UTMs persist, events fire correctly, and conversions are attributed to the expected campaign. In social platform analytics, confirm that the linked destination and campaign windows align with what your reports claim.
Finally, build a reporting cadence that combines execution metrics and business metrics in one view. A practical dashboard includes scans, unique scans, sessions, engaged sessions, top landing pages, outbound clicks to social networks, conversions, conversion rate, and revenue or leads. Review it weekly for evergreen campaigns and daily for launches, events, or paid amplification periods. Over time, this hub-and-spoke approach to QR codes for social media gives you a reusable measurement model for every future activation.
Measuring social media traffic from QR codes is not complicated once the framework is in place. Use dynamic QR codes, tag every destination consistently, send visitors to purpose-built mobile pages, and track events that reflect real user intent. Then compare scan data with analytics sessions and conversion outcomes so you can tell which campaigns create value, not just attention.
The main benefit is clarity. Instead of guessing whether a poster, package insert, creator handout, or event display helped social growth or website traffic, you can prove what happened and improve the next campaign with confidence. That is especially important in mobile QR codes for marketing, where small execution details, such as CTA wording, landing-page speed, or code placement, often decide performance.
If you manage QR codes for social media, audit one live campaign this week. Check the code type, confirm the UTM structure, test the mobile journey, and review whether your dashboard shows scans, sessions, and conversions together. Once those pieces are connected, QR becomes a measurable acquisition channel instead of a black box.
Frequently Asked Questions
How do you accurately measure social media traffic from QR codes?
To accurately measure social media traffic from QR codes, you need to make sure every scan leads to a URL that can be identified inside your analytics platform. The most reliable setup starts with a dynamic QR code rather than a static one, because dynamic codes let you update the destination URL, apply tracking parameters, and review scan activity without reprinting the code. From there, use a tagged landing page URL with UTM parameters such as utm_source, utm_medium, and utm_campaign so your web analytics tool can attribute visits correctly. For example, if a QR code appears in an Instagram Story promotion, the destination URL should clearly identify Instagram as the source, social as the medium, and the specific campaign name tied to that asset.
Once the code is live, measurement should go beyond scan counts. A scan only tells you that someone opened the QR code destination; it does not confirm that the user stayed, engaged, converted, or generated revenue. That is why marketers should connect QR traffic to web analytics platforms such as Google Analytics 4, where they can track sessions, engaged sessions, events, purchases, lead submissions, and assisted conversions. When this is paired with platform reporting from social networks, you can compare how a campaign performed both inside the social app and after users arrived on your site. That full view is what turns QR code reporting from a vanity metric into a usable acquisition measurement system.
What is the difference between QR code scan data and website analytics data?
QR code scan data and website analytics data measure two different parts of the user journey, and understanding the distinction is essential. Scan data comes from the QR code platform and typically shows how many times the code was scanned, when scans occurred, what type of device was used, and sometimes approximate location data. This is useful for understanding top-of-funnel response to a printed sign, packaging insert, poster, event display, or social promotion. However, scan data alone does not tell you what happened after the person opened the link.
Website analytics data begins after the user actually lands on your site and your analytics tag fires. This is where you can measure sessions, bounce or engagement behavior, pages viewed, form completions, sign-ups, purchases, and revenue. In some cases, a scan may not become a recorded session if the page fails to load, the user exits immediately, or consent settings prevent tracking. Because of that, scan totals and session totals will rarely match perfectly. The best practice is to use scan data as the response indicator and website analytics as the performance indicator. Together, they tell a more complete story: how many people were curious enough to scan, and how many of those people became meaningful visitors or customers.
Which UTM parameters should be used for QR codes shared through social media campaigns?
The core UTM parameters for QR codes used in social campaigns are utm_source, utm_medium, and utm_campaign. These three fields create the foundation for attribution in most analytics tools. utm_source should identify the platform or traffic origin, such as instagram, facebook, tiktok, or linkedin. utm_medium should describe the marketing channel in a standardized way, often using values like social, paid_social, or influencer depending on your reporting conventions. utm_campaign should name the broader initiative, promotion, launch, or seasonal effort so all related traffic can be grouped together in reporting.
For more granular analysis, add utm_content to distinguish between different QR code placements, creative versions, or calls to action. For example, if the same campaign uses separate QR codes on a reel graphic, an in-store sign, and a product insert, utm_content can identify which specific asset drove the visit. Some teams also use utm_term for internal categorization, though it is less critical for QR measurement unless you have a well-defined taxonomy. The key is consistency. If naming conventions change across campaigns, reporting becomes fragmented and difficult to trust. A documented UTM framework helps ensure that every QR-driven visit from social media is categorized correctly and can be analyzed by campaign, channel, and creative without manual cleanup later.
Why are dynamic QR codes better than static QR codes for traffic tracking?
Dynamic QR codes are better for traffic tracking because they separate the printed code from the final destination URL. That means you can update the landing page, fix broken links, add or revise UTM parameters, and redirect traffic based on campaign needs without changing the visible QR code itself. This flexibility is especially important for social media marketing, where campaigns evolve quickly and marketers often need to test offers, swap landing pages, or extend promotions after materials have already been distributed. With a static QR code, the destination is locked in permanently, so any tracking mistake or URL change can require replacing the code entirely.
Dynamic QR platforms also typically provide scan-level reporting, which adds another layer of insight beyond web analytics alone. You can review scan volume by date, device type, time, and location, and then compare that information with session and conversion data in your analytics platform. This is useful when diagnosing performance issues. For instance, if scans are high but sessions are low, you may have a page load problem, a weak mobile experience, or a mismatch between user expectation and landing page content. In short, dynamic QR codes support better attribution, faster optimization, and stronger long-term campaign control, making them the preferred choice for marketers who want serious measurement rather than just a functional link.
What metrics matter most when evaluating the performance of QR code traffic from social media?
The most important metrics depend on your goal, but strong QR code evaluation usually starts with scans, sessions, engagement, conversions, and revenue. Scans show initial interest and help you understand whether the QR placement or creative attracted attention. Sessions reveal how many scans turned into actual site visits. Engagement metrics such as engaged sessions, average engagement time, scroll depth, or key event completion help you judge traffic quality rather than just volume. If your QR code campaign is designed to generate leads or sales, conversion rate becomes one of the most important indicators because it shows whether the landing page and offer matched the audience’s intent.
Revenue and return on ad spend are especially valuable for ecommerce or performance-focused campaigns, because they tie QR activity directly to business outcomes. Beyond those primary numbers, marketers should also compare metrics by platform, creative, audience segment, and landing page variant to identify what is truly driving performance. For example, one social channel may produce fewer scans but far higher conversion rates, making it more efficient overall. Another may generate strong scan volume but weak engagement, signaling low-intent traffic. The most mature measurement approach looks at the full funnel: scan rate for attention, session rate for visit quality, conversion rate for business impact, and revenue for final value. That complete framework allows marketers to optimize QR campaigns with the same rigor they apply to other digital acquisition channels.