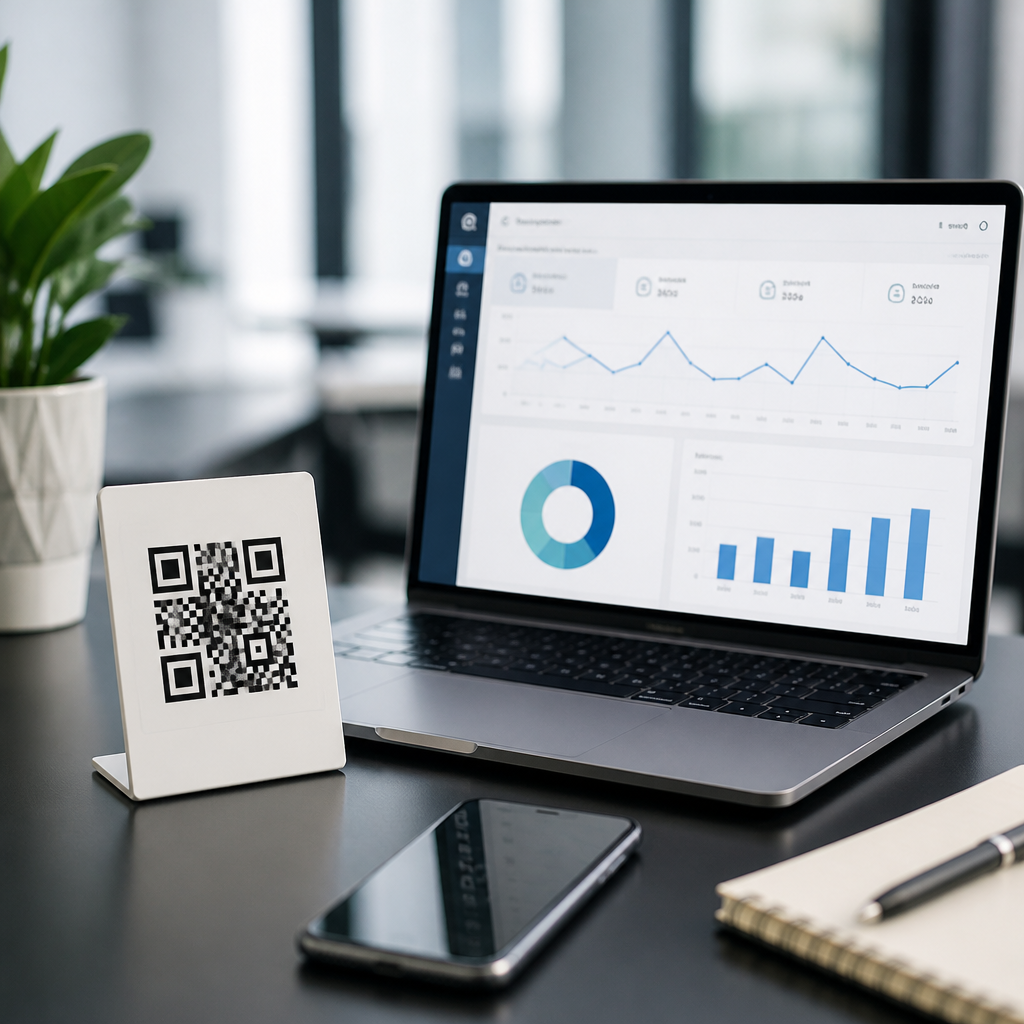

QR code analytics dashboards turn every scan into measurable behavior, which is why they have become essential inside modern QR code tracking platforms. A dashboard is the reporting interface that collects scan events, organizes them into metrics, and helps teams understand performance across campaigns, locations, devices, and time periods. In practice, I have seen the difference between a basic generator and a serious tracking system immediately: one only creates a code, while the other shows who scanned, when they scanned, where they were, what device they used, and what happened next. For marketers, retailers, event organizers, restaurants, publishers, and product teams, that visibility matters because offline touchpoints are otherwise difficult to measure. If a poster, package insert, trade show sign, direct mail piece, or menu sends traffic to a digital destination, decision makers need evidence that the placement is working. The best QR code analytics dashboards provide that evidence clearly, accurately, and fast enough to support action.
To evaluate a platform well, it helps to define the core terms. A static QR code points to a fixed destination and usually offers little or no flexible tracking after printing. A dynamic QR code uses a short redirect URL, allowing the destination to change without reprinting and enabling scan analytics. A scan event is the recorded interaction when a user opens the code with a camera or scanner app. Attribution connects that event to a campaign, channel, location, or conversion outcome. Reporting latency is the delay between the scan and the dashboard update. Data retention defines how long historical records remain available. These details sound technical, but they shape whether a dashboard can answer practical questions such as which store display outperformed, whether direct mail lifted traffic, or whether a packaging QR code drove repeat use. Choosing the right dashboard is not just a software decision; it affects campaign optimization, budget allocation, compliance, and confidence in results.
Core Metrics Every QR Code Analytics Dashboard Should Include
The first thing to look for is a dashboard that covers the essential metrics without forcing users to build custom reports for basic answers. At minimum, a platform should show total scans, unique scans, scan rate over time, geographic distribution, device and operating system breakdown, browser data, and referral context when available. In strong systems, these metrics are visible at both account level and individual code level, so teams can compare one campaign against another and still drill into a single asset. I consider unique scans especially important because raw total scans can be inflated by repeat interactions from the same user, particularly for restaurant menus, product manuals, or event passes that people access multiple times.
Time-based reporting also needs more depth than a simple cumulative line chart. Useful dashboards let you segment by hour, day, week, or custom date range, then compare periods to identify lift after a campaign launch or decline after a placement change. Geographic data should go beyond country and, where lawful and technically feasible, include state, city, or DMA-level detail. Device metrics are not cosmetic; they can reveal whether the landing page experience is optimized for iPhone versus Android, or whether older devices struggle with large file downloads. The strongest platforms also support UTM parameters, first-party analytics integrations, and event tracking so a scan is not the end of the story. If a code drives traffic to a product page, app download, registration form, or payment screen, the dashboard should connect scans to downstream behavior whenever possible.
Segmentation, Filtering, and Drill-Down Capabilities
A QR code analytics dashboard becomes truly valuable when it makes segmentation easy. Teams rarely need just one top-line number; they need to compare campaigns by region, placement, creative version, date, and destination. In my experience, weak platforms fail here. They show a colorful overview but make it hard to isolate one mail drop, one store chain, or one product SKU. Strong dashboards let users filter quickly by campaign tag, folder, account owner, QR code type, landing page, or custom label. That structure is critical for organizations managing hundreds or thousands of codes across distributed teams.
Drill-down capability matters just as much. A CPG brand might start at a national summary, then narrow to scans from a specific package design in the Northeast during a retail promotion window. An event team may need to compare scans from entrance signage, exhibitor booths, and follow-up brochures. A franchise business may want one master dashboard for headquarters and restricted subviews for local operators. The platform should support this without exporting raw logs into spreadsheets for every question. Role-based access control, saved report views, and shareable links help operationalize data across departments. If the dashboard cannot adapt to the way campaigns are organized in the real world, teams will stop trusting it and revert to ad hoc reporting.
Data Accuracy, Privacy, and Compliance Standards
Data quality is where many QR code tracking platforms separate themselves. Dashboard visuals are only as good as the collection method behind them. Look for platforms that explain how they count unique scans, handle bot traffic, detect duplicate events, and process redirects. If a system cannot distinguish between genuine user scans and automated link checks, totals can become misleading. Reporting transparency is a positive sign: reputable vendors document refresh intervals, geolocation method, IP handling, and known limitations. No analytics stack is perfect, but reliable providers are explicit about methodology.
Privacy and compliance deserve equal scrutiny. Because scan analytics may involve IP-derived location, device metadata, and campaign attribution, the platform should support consent-aware practices and region-specific controls. For businesses operating in Europe, features that help align with GDPR requirements are important, including data processing terms, retention settings, and deletion workflows. In healthcare or regulated sectors, teams may need stricter governance even if the QR code itself does not collect sensitive data. Security basics should include HTTPS redirects, access permissions, SSO support for enterprise plans, audit logs, and documented uptime commitments. A dashboard that is rich in data but weak in governance creates unnecessary legal and operational risk.
Integrations, Automation, and Reporting Workflows
The best dashboards do not live in isolation. They connect scan data to the rest of the marketing and analytics stack, reducing manual work and improving attribution. At minimum, serious QR code tracking platforms should integrate with Google Analytics 4, often through tagged destinations or event frameworks, and support connections to CRM, CDP, or marketing automation tools such as HubSpot, Salesforce, Zapier, or Make. For enterprise teams, API access is often the deciding feature because it allows raw scan data to flow into BI tools like Looker Studio, Tableau, or Power BI for blended reporting alongside paid media, email, retail, and web analytics.
Automation features are especially useful when managing recurring campaigns. Scheduled email reports, anomaly alerts, threshold notifications, and webhook triggers save time and help teams act faster. For example, a restaurant group can receive an alert if scans on a new digital menu QR code collapse after a print batch error. A publisher can route high-performing issue scans into a broader campaign dashboard automatically. Report exports should be available in CSV and PDF, but export alone is not enough. A good dashboard keeps stakeholders aligned through persistent live views, white-labeled reports for agencies, and data freshness that matches business needs. If updates lag by many hours during a live event or product launch, the dashboard loses operational value.
How Leading Platform Features Compare
When comparing QR code analytics dashboards, use a structured checklist rather than judging by interface design alone. The table below summarizes the feature areas that usually matter most in real evaluations.
| Feature area | What good looks like | Why it matters |
|---|---|---|
| Scan metrics | Total, unique, repeat, time series, campaign level and code level | Shows both reach and engagement quality |
| Location reporting | Country, region, city, map view, exportable data | Supports local optimization and retail analysis |
| Device insights | OS, browser, device type, app context when available | Improves landing page and app experience decisions |
| Attribution | UTM support, destination analytics tie-in, conversion tracking | Connects scans to business outcomes |
| Administration | Folders, tags, user roles, SSO, audit trail | Essential for scale and governance |
| Integrations | API, webhooks, GA4, CRM, BI connectors | Prevents siloed reporting and manual exports |
In practical buying decisions, not every company needs the most advanced version of each category. A local café may care mainly about daily scans and menu traffic, while a national retailer may require store-level segmentation, SLA-backed uptime, and API access. The right question is not which platform has the longest feature list, but which dashboard supports your reporting model today and your growth model next year. That is why trials, sample exports, and a live demo using your own campaign structure are more informative than a polished homepage claim.
Questions to Ask Before You Choose a Dashboard
Before signing with any provider, ask direct questions that reveal how the dashboard performs under normal business conditions. How quickly do scan events appear? How are unique users estimated? Can one printed dynamic code be reassigned safely without breaking attribution? Are historical redirects preserved for audit purposes? What happens if a destination URL fails? Can you annotate reports to explain spikes from trade shows, TV placements, or influencer pushes? Does the system support bulk creation and bulk editing for large deployments? These answers tell you whether the platform was built for actual operations or just light campaign use.
Also ask about ownership and portability. You should be able to export your data, understand retention terms, and avoid being trapped if pricing changes. For agencies, white-label reporting and client-level permissions can be decisive. For in-house teams, internal linking between campaign guides, QR code creation workflows, and reporting docs improves adoption. The best QR code analytics dashboards reduce uncertainty: they show what happened, why it likely happened, and what to change next. If you are comparing QR code tracking platforms, prioritize accuracy, segmentation, integrations, and governance over surface-level polish. Start with a pilot, define success metrics in advance, and choose a dashboard that can turn scans into decisions, not just charts.
Frequently Asked Questions
1. What should a strong QR code analytics dashboard include?
A strong QR code analytics dashboard should go far beyond a simple scan count. At a minimum, it should show total scans, unique scans, scan timestamps, device types, operating systems, and location-level data. Those baseline metrics help teams understand not only how often a QR code is being used, but also who is engaging with it, when they are engaging, and from what kind of device. That level of visibility is what separates a true reporting platform from a basic QR code generator.
It is also important to look for segmentation and filtering tools. A useful dashboard should let you break down performance by campaign, date range, geography, traffic source, and even individual QR code variations. If a business is running multiple print, packaging, retail, or out-of-home campaigns at once, these filters make reporting practical instead of overwhelming. Teams should be able to compare one code against another, identify top-performing placements, and quickly spot where engagement drops off.
Visualization matters too. Good dashboards present metrics in a way that is easy to interpret, using charts, trend lines, maps, and side-by-side comparisons. A platform may collect a large amount of scan data, but if the interface makes it difficult to find insights, the data loses much of its value. The best dashboards help marketers and operations teams move from raw events to actionable decisions quickly.
Finally, a strong dashboard should support export options, campaign attribution, and ideally some level of integration with broader analytics or marketing systems. QR code reporting is most valuable when it fits into a larger measurement strategy. If the dashboard can connect scan behavior to downstream outcomes such as site visits, form fills, purchases, or foot traffic patterns, it becomes much more than a reporting screen. It becomes a decision-making tool.
2. Why are unique scans and total scans both important in QR code reporting?
Unique scans and total scans measure two different aspects of engagement, and both are necessary for a complete view of performance. Total scans tell you overall activity volume. That metric is useful for understanding reach and momentum, especially during a campaign launch, event, product rollout, or promotional push. If total scans rise sharply after a placement change or creative update, that usually indicates stronger visibility or better audience response.
Unique scans, by contrast, help estimate how many individual users engaged with the QR code, rather than how many times the code was scanned overall. This distinction matters because repeated scans can inflate performance if you only look at total volume. For example, if one person scans a code several times to revisit a menu, redeem an offer, or complete a process later, total scans increase, but the number of actual people reached may remain the same. Unique scans provide a cleaner signal of audience size.
Together, these two metrics reveal engagement patterns. If total scans are high but unique scans are relatively low, that may suggest repeat usage, strong retention, or a multi-step experience that encourages return visits. In some cases, that is a positive sign. In others, it can indicate friction, such as users rescanning because the destination page was unclear, slow, or not memorable. If both total and unique scans are rising, that generally points to stronger distribution and broader audience reach.
A capable QR code analytics dashboard should present both metrics clearly and make it easy to compare them over time. That lets teams answer more meaningful questions: Are we attracting new users, or seeing repeat interactions from the same audience? Is this code serving as a one-time conversion point, or an ongoing access tool? These are the kinds of insights that turn scan data into strategy.
3. How important are time, device, and location data in a QR code analytics dashboard?
Time, device, and location data are among the most valuable dimensions in QR code analytics because they explain the context behind scan behavior. Time-based reporting shows when scans happen by hour, day, week, or campaign period. This helps identify usage peaks, seasonal patterns, and the effectiveness of launch windows or time-sensitive promotions. A code placed in a retail environment may perform best on weekends, while one used in B2B print materials may see more scans during business hours. Without time-based reporting, those patterns are easy to miss.
Device data is equally important because it influences the user experience after the scan. A dashboard should ideally report device type, operating system, and sometimes browser category. If most scans come from mobile devices, which is often the case, landing pages need to be optimized for small screens, fast load times, and touch-friendly interactions. If one operating system shows unusually low engagement after the scan, that may point to a technical issue, redirect problem, or poor page performance on that platform.
Location data adds another crucial layer. Geographic reporting can reveal where campaigns are resonating and where they are underperforming. For national or regional campaigns, this makes it easier to compare market-level results. For physical placements such as store signage, product packaging, direct mail, or event displays, location trends can validate distribution strategy and help teams decide where to invest more heavily. Even broad location data can be useful for understanding whether scans are happening in expected markets.
When combined, time, device, and location metrics create a much more complete picture than scan totals alone. They help answer practical questions such as when users are most engaged, what devices they use to access the destination, and where physical campaign placements are driving the strongest response. These dimensions turn a dashboard into a real optimization tool rather than a passive reporting page.
4. How can a QR code analytics dashboard help optimize campaigns?
A QR code analytics dashboard helps optimize campaigns by showing what is actually happening after a code is deployed. Instead of guessing whether a printed sign, package insert, flyer, poster, or in-store display is working, teams can measure scan activity and compare performance across assets. This allows marketers to identify winning placements, messaging, and offers based on real user behavior rather than assumptions. In many cases, even a small dashboard insight can lead to a significant performance improvement.
For example, if one QR code placement consistently outperforms another, that may indicate stronger visibility, better creative framing, or a more relevant audience context. If scans spike at certain times of day or in specific locations, campaign timing and distribution can be adjusted accordingly. If device data shows that nearly all scans come from smartphones but the landing page has a high bounce rate, the issue may not be the code itself but the post-scan experience. The dashboard helps isolate where the problem or opportunity exists.
Optimization also depends on trend analysis. A good dashboard should let teams monitor changes over time instead of relying on a single static snapshot. If engagement drops after the first week of a campaign, the creative may be losing impact. If scans rise after changing signage, call-to-action copy, or placement height, those changes can be rolled out more broadly. This kind of iterative improvement is one of the biggest advantages of using dynamic QR code tracking over static, unmeasured codes.
Ultimately, the dashboard should support faster decision-making. The best platforms do not just store scan logs; they make campaign performance understandable enough that teams can act on it. That means testing creative variations, reallocating budget, improving landing pages, refining audience targeting, and proving ROI more confidently. In that sense, analytics are not just a reporting feature. They are central to making QR campaigns smarter over time.
5. What is the difference between a basic QR code generator and a QR code tracking platform with a real dashboard?
A basic QR code generator creates a scannable code and usually stops there. Its main purpose is utility: turning a URL, PDF, contact card, or other destination into a QR code image that can be downloaded and used. While that may be enough for simple one-off needs, it offers very little insight into performance. Once the code is printed or shared, there is often no reliable way to know how often it was scanned, where scans came from, or whether the campaign was effective.
A QR code tracking platform with a real dashboard is designed for measurement, analysis, and optimization. It captures scan events and organizes them into meaningful metrics such as total scans, unique users, time trends, geography, device breakdowns, and campaign-level comparisons. This transforms the QR code from a passive access point into a measurable channel. Businesses can see what is working, what is underperforming, and where to adjust.
Another major difference is flexibility. Tracking platforms often support dynamic QR codes, which allow the destination to be updated without changing the printed code itself. That matters for active campaigns, long-term packaging, retail materials, and distributed signage. Instead of reprinting assets every time a URL changes, teams can redirect the same code while preserving continuity in the analytics. This is especially useful when testing offers, changing landing pages, or responding quickly to market conditions.
In practical terms, the difference becomes obvious as soon as performance matters. A basic generator helps you produce a code. A full tracking platform helps you understand behavior. If QR codes are part of a marketing, customer experience, retail, events, or operational workflow strategy, the dashboard is not a luxury feature. It is the part that makes the channel accountable, measurable, and worth scaling.